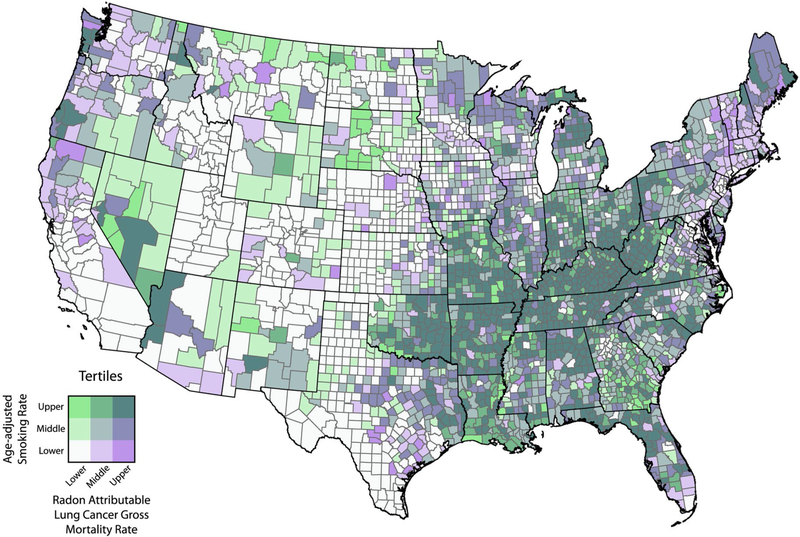
Figure 5.
Age-adjusted smoking rates and estimates of radon-attributable lung cancer mortality are illustrated. The darker purple counties represent the areas with the lowest smoking rates yet the highest estimated radon-attributable lung cancer deaths. The dark green counties are those areas with the highest smoking rates and the highest radon-attributable lung cancer mortality. The map was created by Andrew S. Berens at the Geospatial Research Analysis and Services Program (GRASP), Division of Toxicology and Human Health Sciences, Agency for Toxic Substances and Disease Registry, Centers for Disease Control and Prevention, Atlanta, GA.

