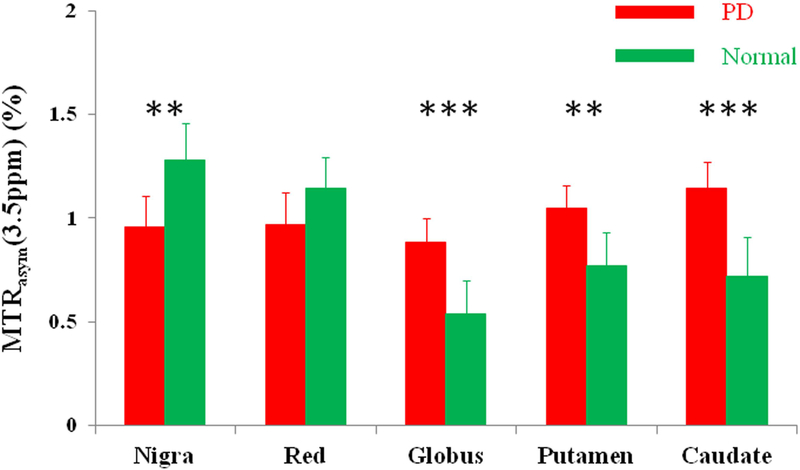
Figure 7.
Comparison of the average MTRasym(3.5ppm) signals of the substantia nigra, red nucleus, globus pallidus, putamen, and caudate for Parkinson’s disease (PD) patients (n = 27) and normal controls (n = 22). In regions of the substantia nigra and red nucleus, the MTRasym(3.5ppm) signals were reduced in PD patients, compared to normal controls. In regions of the globus pallidus, putamen, and caudate, the MTRasym(3.5ppm) signals were increased in PD patients, compared to normal controls. Reproduced with permission from Li et al., Eur Radiol 2014;24:2631–9.

