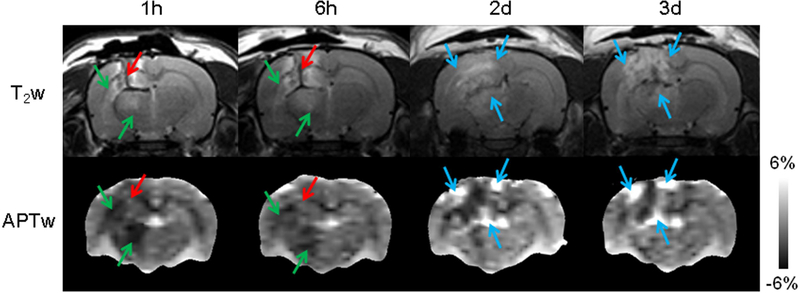
Figure 8.
A typical example of T2w and APTw images of TBI in a rat at different time points. Green arrows: ischemia; red arrows: hemorrhage; blue arrows: inflammatory response (increased inflammatory cell density). Reproduced with permission from Zhang et al., J Cereb Blood Flow Metab 2017;37:3422–32.

