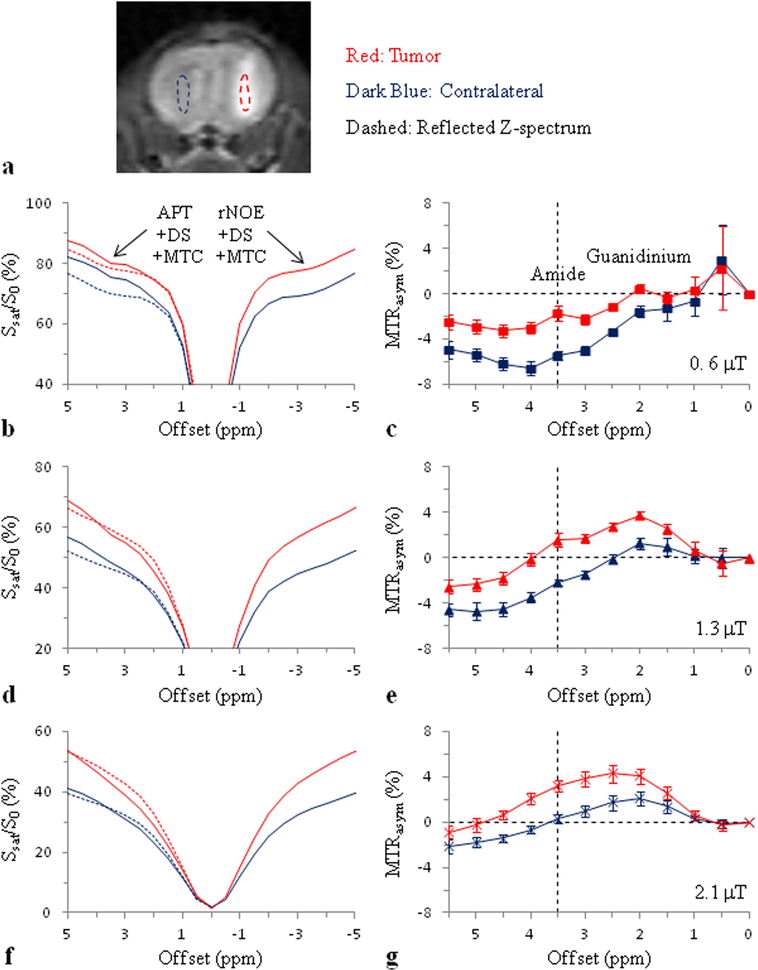
Figure. 9.
Average Z-spectra and MTRasym spectra of brain tumors and contralateral normal brain tissue in a rat 9L gliosarcoma model (n = 8) at 4.7T obtained at three different RF saturation powers and tsat = 4 sec. a: Regions of interest (ROIs) for the image analysis defined on an MT-weighted image at 6 ppm. b, c: B1 = 0.6 μT. The downfield Z-spectra of the tumor and contralateral normal brain tissue are both higher than the corresponding reflected Z-spectra. d, e: B1 = 1.3 μT. f, g: B1 = 2.1 μT. At 3.5 ppm (use green dashed vertical guideline), the tumor Z-spectrum is lower than the corresponding reflected Z-spectrum, while the contralateral downfield Z-spectrum is about equal to the corresponding reflected Z-spectrum. Reproduced with permission and with some additions from Zhou et al., Magn. Reson. Med. 2013;70:320–327.

