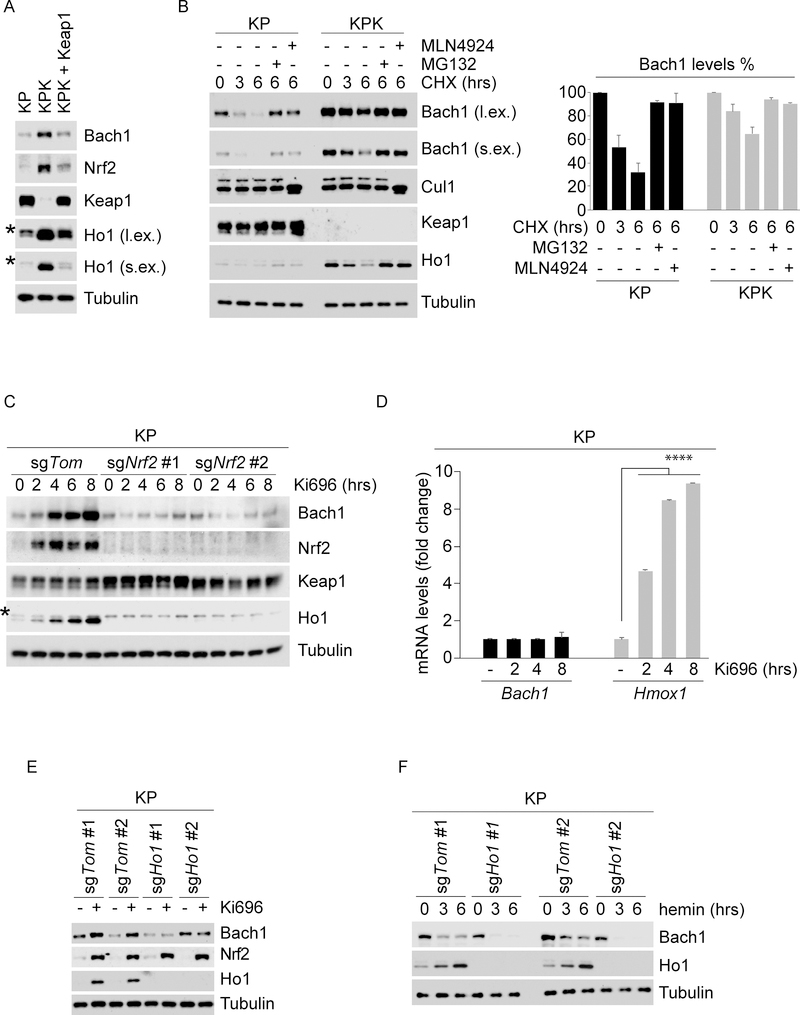
Figure 2. Keap1 loss promotes Bach1 accumulation through Nrf2-dependent induction of Ho1.
(A) KP, KPK and Keap1-reconstituted KPK cells were lysed and immunoblotted as indicated. * denotes a nonspecific band. l.ex., long exposure; s.ex., short exposure.
(B) KP and KPK cells were treated with CHX, collected at the indicated times, lysed, and immunoblotted as indicated. KP and KPK cells were pretreated with either MG132 or MLN4924 30 minutes before CHX treatment. The graph shows the quantification of Bach1 protein levels. Values are presented as means ±SEM. l.ex., long exposure; s.ex., short exposure.
(C) KP-sgTom or 2 different KP-sgNrf2 clones were treated with Ki696, collected at the indicated times, lysed, and immunoblotted as indicated. * denotes a nonspecific band.
(D)KP cells were treated with Ki696 for the indicated times. Relative expression levels of Bach1 and Hmox1 genes were determined by qRT-PCR. Values are presented as means ±SD
(E) Two different KP-sgTom and KP-sgHo1 clones were treated with Ki696 for 3 hours, collected, lysed and immunoblotted as indicated.
(F) The experiment was performed as in (E), except that cells were treated with hemin for the indicated times.

