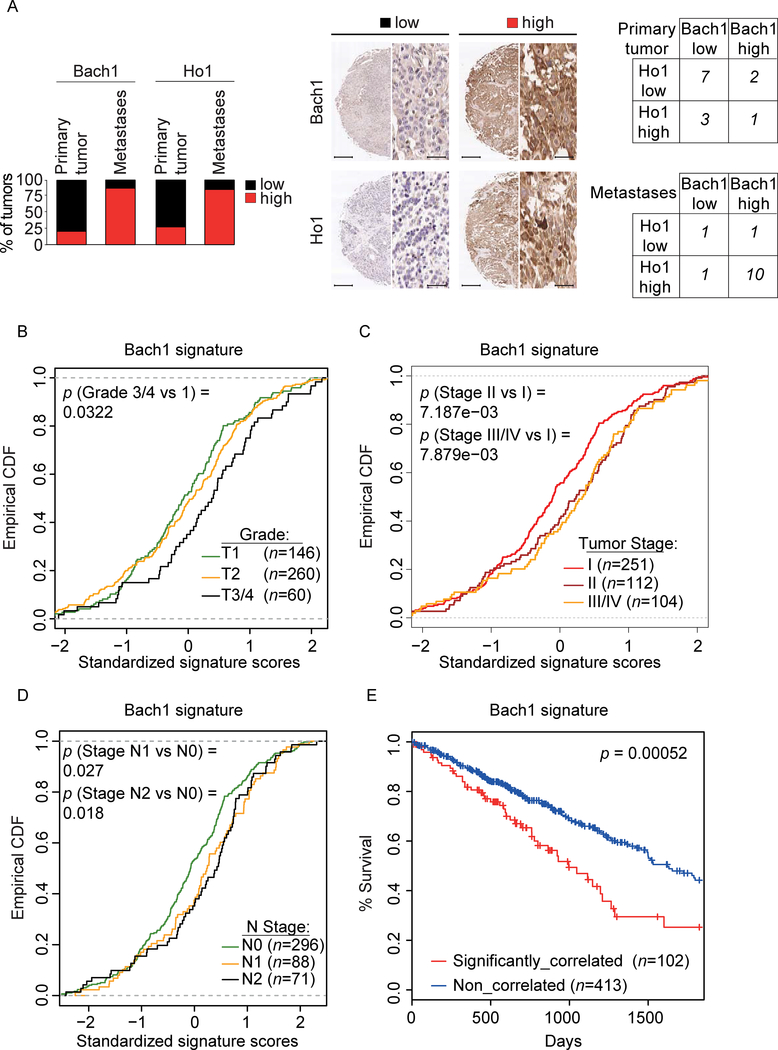
Figure 7. Bach1 levels and its transcriptional signature are associated with poor survival, advanced clinical stage and grade, and presence of metastases in human LUAD.
(A) The graph shows the percentage of primary human LUAD samples with matching metastasis (n = 13) displaying low or high levels of Bach1 and Ho1. Middle panels, representative IHCs. Scale bars, 330 μM for low magnification (3X) and 25 μM for high magnification (40X). Left, contingency tables demonstrating the correlation between Ho1 and Bach1 expression in primary tumors (top) and matching metastases (bottom).
(B) Empirical cumulative distribution function (CDF) plots showing correlation of individual tumors with the Bach1 signature across various tumor grades within the TCGA LUAD cohort.
(C)CDF plots showing correlation of individual tumors with the Bach1 signature across various clinical stages within the TCGA LUAD cohort.
(D) CDF plots showing the correlation of individual tumors with Bach1 signature in primary tumors within the TCGA LUAD cohort with lymph node metastasis (N1, N2) as compared to cohort with no metastasis (N0).
(E) Kaplan–Meier survival curves comparing subjects in the TCGA LUAD cohort stratified by correlation with Bach1 signature. Tumor samples were binned according to their gene expression correlation with Bach1 signature. Subjects harboring the top 20% (n = 102) most correlated tumors exhibited significantly decreased survival as compared to the remaining subjects (n = 413) from the TCGA LUAD cohort.

