
Figure 3.
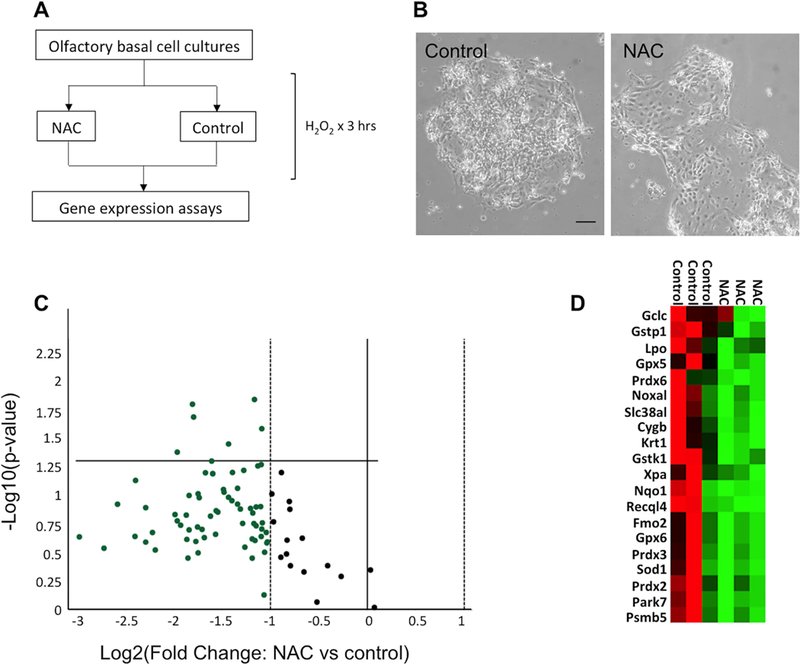
NAC treatment in olfactory cell cultures resulted in decreased expression of oxidative stress pathway genes. (A) Schematic representation of in vitro experiments. (B) Effects of oxidative stress on primary cultures of regenerating OE cells; irregular morphology, floating detached cells and debris are more apparent in control peroxide-treated cultures; bar=50 μm. (C) Volcano plot of the expression of genes involved in oxidative stress pathway, showing down-regulation of many transcripts (green) in response to NAC treatment. (D) Heat map depiction of gene expression changes, listing the 20 transcripts from triplicate experiments found to have lowest p-value on statistical analyses; red represents increased expression, green represents decreased expression.