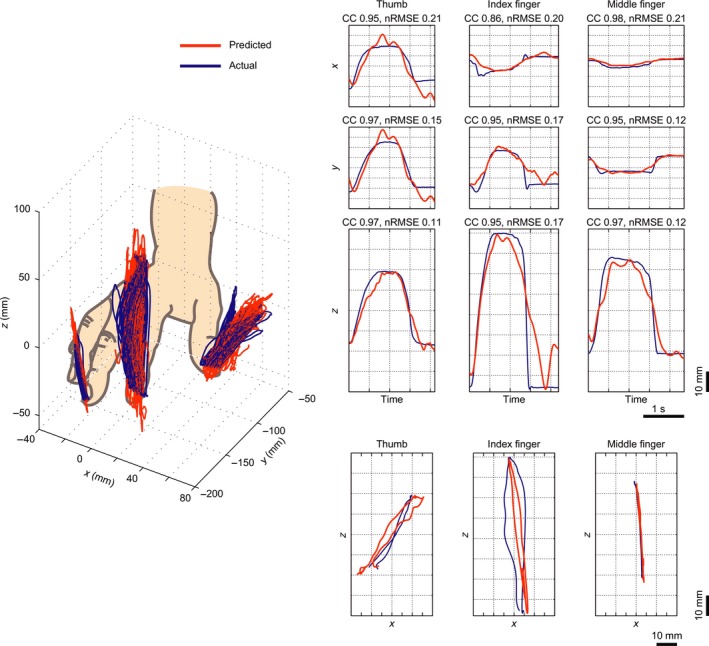
Figure 2.

Fingertip trajectories. Fingertip trajectories (x, y, z coordinates) were decoded from one (epilepsy) patient implanted with ECoG grids (1 cm inter‐electrode distance) over the left hemisphere sensorimotor cortex. In this study signals from nine frequency bands were used: 0–4, 4–8, 8–14, 14–20, 20–30, 30–60, 60–90, and 90–120 Hz. Left panel: 3D view of the finger trajectories. The delta and high‐frequency bands (>90 Hz) contribute most significantly to the trajectory prediction. Predicted (red lines) and actual trajectories (blue lines) for all trials are displayed. Right panel: Examples of the predicted (red lines) and actual trajectories (blue lines) for three individual fingers (thumb, index and middle finger) compared using correlation coefficient (CC) and normalized root‐mean‐square‐error (nRMSE) values. The graphs express changes in x, y, and z coordinates over time, as well as the x–z plane projections (bottom row) of curves in the 3D view (adapted with permission from Nakanishi et al., 2014). [Colour figure can be viewed at http://wileyonlinelibrary.com]
