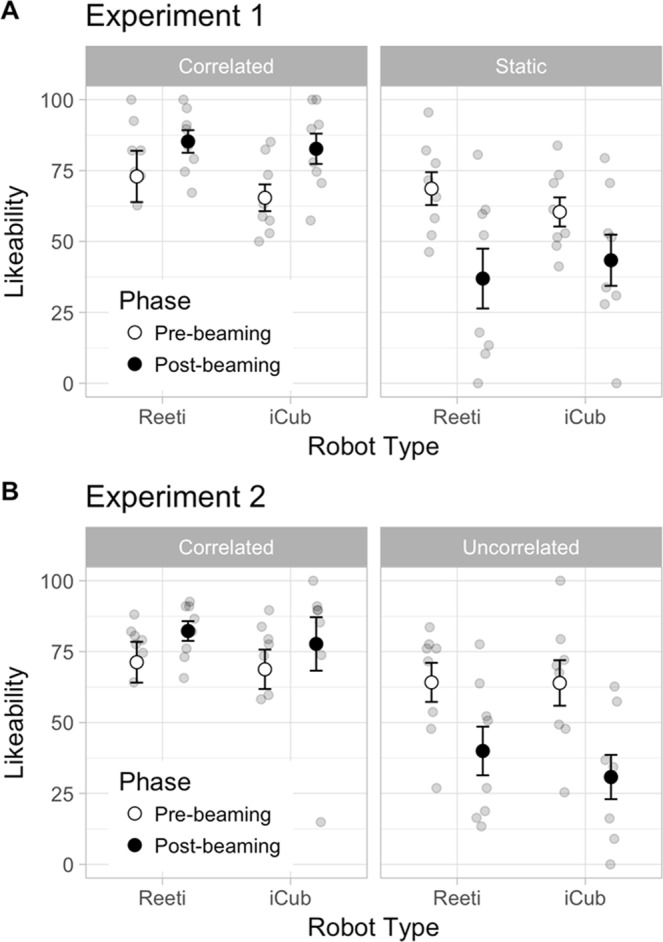
Figure 1.

Likeability result: Means plots showing the distribution of the likeability scores measured in Experiment 1 (A) and Experiment 2 (B), before (Pre-beaming) and after (Post-beaming) beaming inside Reeti and iCub robots. Note the general increased likeability scores in the Correlated as compared to Static and Uncorrelated conditions. The Likeability score can reverse after beaming as a robot can become more likeable after Correlated and less likeable after Static and Uncorrelated conditions. Points: Individual data; Circles: Means; Bars: Standard errors.
