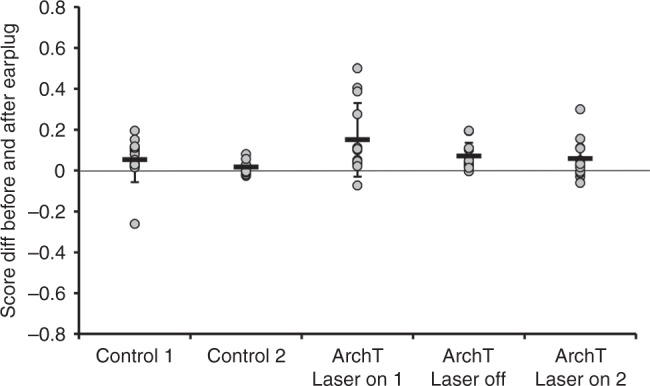
Fig. 5.

Difference between localization accuracy before and after monaural occlusion. The difference between the proportion of correct responses is shown for individual animals prior to plugging one ear and following removal of the earplug. The control group of ferrets underwent two periods of training (Control 1, n = 13, and Control 2, n = 9), whereas the animals in which ArchT was expressed in high-frequency A1 received three blocks of training whilst wearing an earplug, with laser light delivered to the implanted optical fiber on each trial during the first (ArchT laser on 1, n = 13) and third block (ArchT laser on 2, n = 12), but not during the second block (ArchT laser off, n = 13). The gray symbols represent data from individual animals, and the tick marks and error bars indicate the mean ± SD. Source data are provided as a Source Data file
