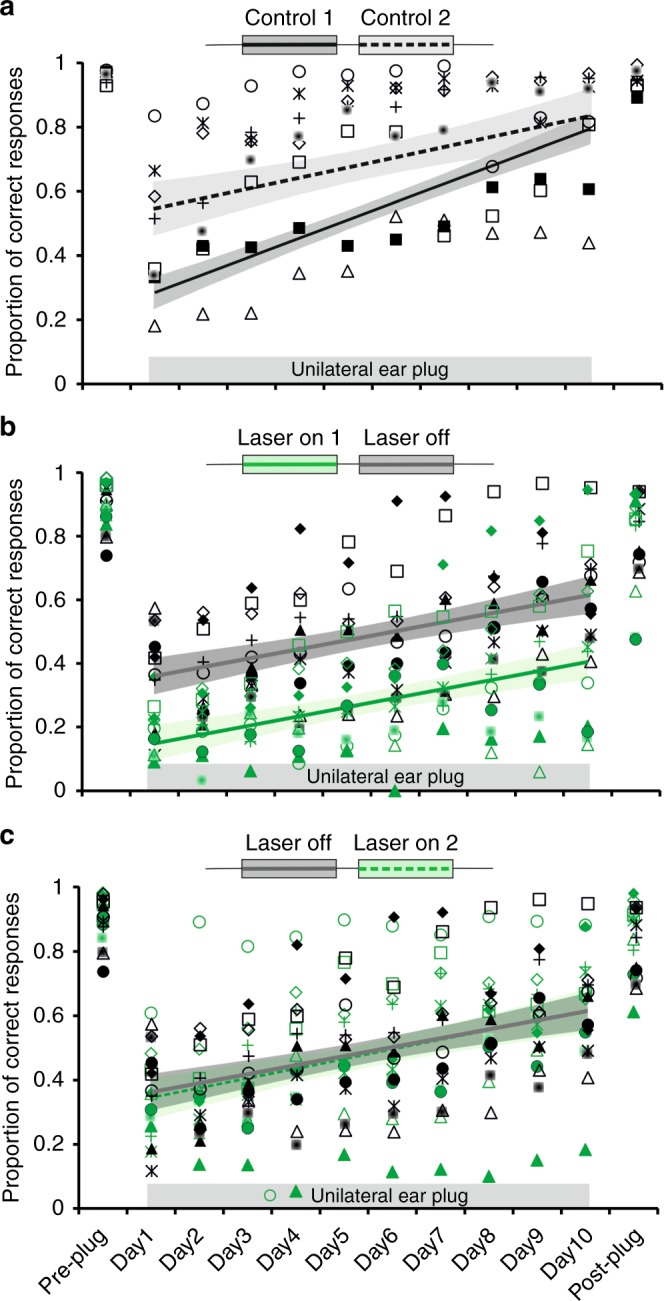
Fig. 6.

Learning retrieval during successive periods of monaural occlusion. Proportion of correct responses (averaged across all speaker locations) is shown in the session before the right ear was plugged (Pre-plug), on each of the 10 days over which the plug was worn (days 1–10), and in the session following its removal (Post-plug). a Data from the control group (n = 13) are shown for two 10-day periods of monaural occlusion: lines and shaded areas correspond to the best linear fits and 95% confidence intervals, respectively, while the symbols represent individual performance during the second period of monaural deprivation (individual animal data for the first period are shown in Fig. 4b). b Data from the ferrets in which ArchT was expressed in high-frequency A1 (n = 13) are shown for the first two 10-day periods of monaural occlusion, with light delivered to the implanted optical fiber to suppress cortical activity on every trial during the first block (laser on 1, green), but not during the second block (laser off, gray). Colored symbols represent individual performance under each condition. c Data from the ferrets in which ArchT was expressed in high-frequency A1 for the second and third 10-day periods of monaural occlusion; the laser was off during the second block (gray, as in b, n = 13), but on during each stimulus presentation in the third block (laser on 2, green, n = 12). Note that perturbing cortical activity no longer has any effect on the localization accuracy of the animals. Source data are provided as a Source Data file
