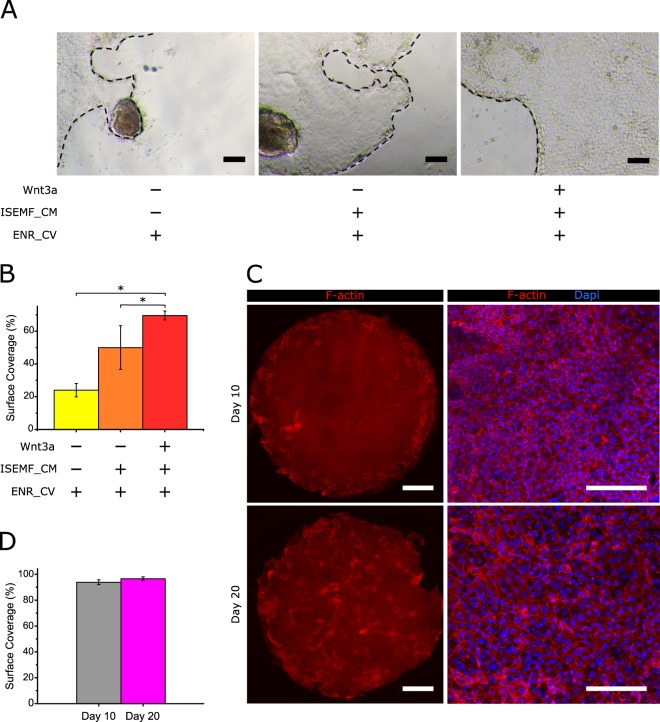
Figure 4.
Biochemical factors produced by intestinal subepithelial myofibroblasts and Wnt3a boost epithelial growth. (A) Representative bright field images of epithelial monolayers grown on Matrigel-coated polystyrene plates and cultured with ENR_CV-medium, ISEMF_CM supplemented with ENR_CV, and ISEMF_CM supplemented with ENR_CV and Wnt3a after 5 days of culture. Black dashed lines mark the epithelial borders. Scale bars: 100 µm. (B) Graph showing the surface coverage percentage (with respect to the total substrate area) for each culture condition. Quantitative data was evaluated from 12 randomly selected regions from bright field images obtained from 3 different samples for each condition (n = 3). The data is represented as mean ± standard deviation. Statistics were performed with Student’s t-test setting *p < 0.05. (C) Representative fluorescence images of F-actin and cell nuclei for monolayers cultured in Transwell inserts under the asymmetric administration of ENR_CV-medium supplemented with ISEMF_CM and Wnt3a, at day 10 (upper row) and 20 (lower row) of culture. Left panels show the tile-scan images of the entire Transwell membrane surface (0.33 cm2), while right panels show higher magnification images for each condition. Scale bars: 1 mm (left panel) and 100 µm (right panel). (D) Graph plotting the surface coverage percentages with respect to the total substrate area as a function of the cell culture time. Six samples were analysed for day 10 (n = 6) and four samples for day 20 (n = 4). ENR_CV-medium: EGF, Noggin, R-Spondin 1, CHIR99021 and valproic acid containing -medium and ISEMF_CM: Intestinal subepithelial myofibroblast-conditioned medium. The data were represented as mean ± standard deviation. Statistics were performed through a Student’s t-test setting *p < 0.05.

