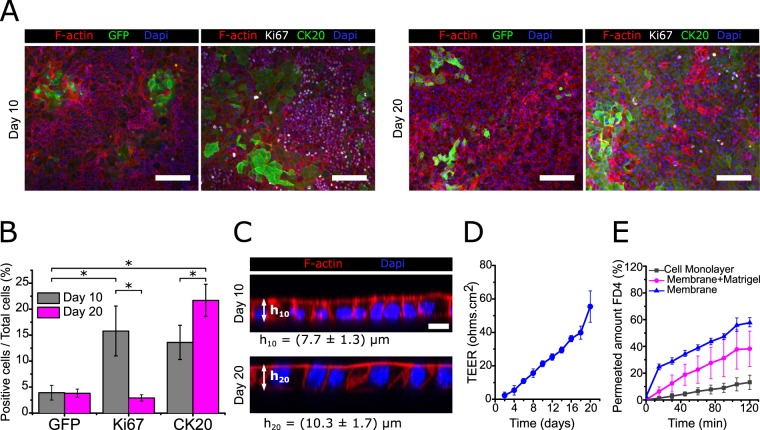
Figure 5.
Epithelial monolayers self-organized in crypt and villus-like domains show effective barrier function. (A) Representative immunofluorescence images of epithelial monolayers stained for GFP, Ki67, and CK20 after 10 and 20 days in culture on Matrigel-coated Transwell inserts. Scale bars: 100 µm. (B) Graph plotting the percentage of positive cells from the total cell number counted for each marker at day 10 (n = 3) and at day 20 (n = 2) of culture. The data were represented as mean ± standard deviation (statistics performed through pairwise Student’s t-test, significance level set at *p < 0.05). (C) Representative orthogonal cross-sections of randomly selected flat epithelial monolayers stained for F-actin and nuclei at day 10 and 20 of culture. Scale bars: 10 µm. The average cell heights, represented in the figure, were computed as 7.7 ± 1.3 µm and 10.3 ± 1.7 µm for day 10 (h10) and day 20 (h20), respectively. For the measurements ten randomly selected cells per sample were measured and a total of three independent samples (n = 3) for each condition were analysed. The data were represented as mean ± standard deviation. (D) Plot of the transepithelial electrical resistance (TEER) values measured for the epithelial monolayers as a function of the cell culture time. Reported values are corrected from their corresponding background and account for the total area of the samples. Values are reported as the mean ± standard deviation and correspond to three independent experiments with 5 technical replicas (n = 5). (E) Plot of the amount of permeated FITC-dextran 4.4 kDa (FD4) through the epithelial monolayers grown on Transwell inserts. As controls, the flux through the porous Transwell insert membranes coated with a thin layer of Matrigel and through the porous membranes alone was measured. Values are reported as the mean ± standard deviation and correspond to three technical replicas (n = 3).

