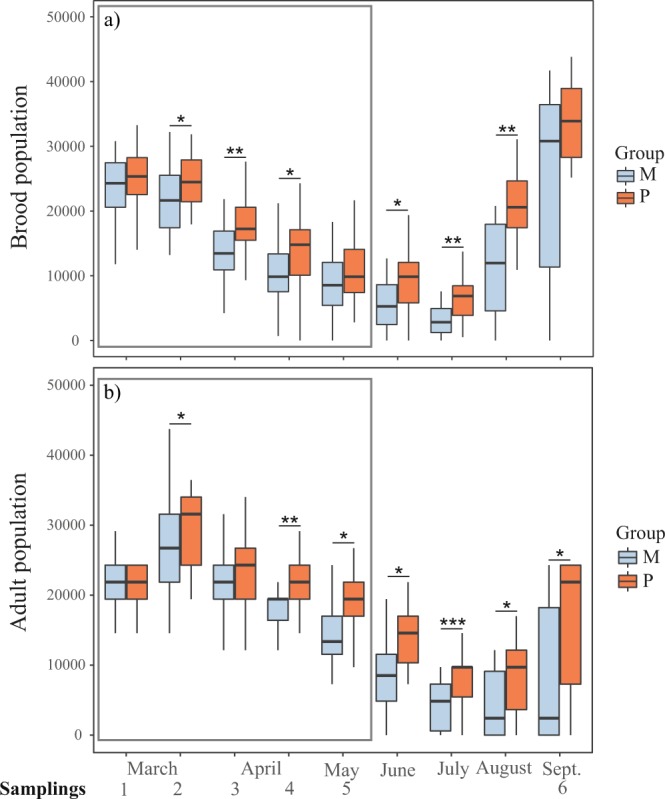
Figure 3.

Brood (a) and adult (b) population during the nutritional stress period (squared in grey) and during the winter and spring. Colonies from group M (monofloral) are represented in blue and colonies from group P (polyfloral) are represented in orange. Boxes show 1st and 3rd interquartile range and median represented by a line. Whiskers include the values of 90% of the samples. Significant differences of pairwise comparisons at each sampling time are represented as * when p ≤ 0.05, ** when p ≤ 0.01, and *** when p ≤ 0.001.
