
Figure 2.
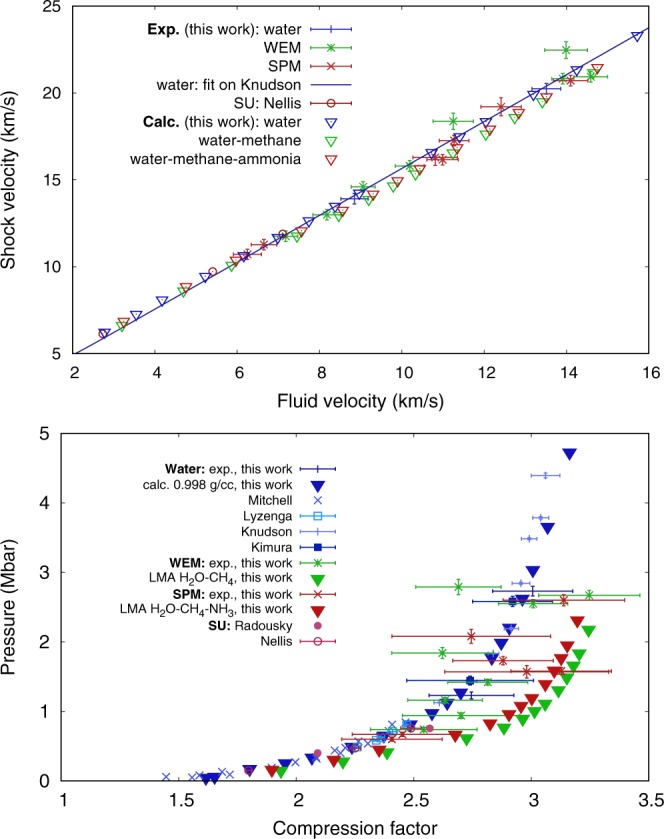
Top. Experimental shock - fluid velocity data on water, WEM, and SPM (blue, green, and red points with error bars, respectively) compared to DFT-MD calculations (triangles). A linear fit on previous water data26 and previous experimental data on synthetic Uranus22 (similar to the SPM) are shown for comparison. Bottom. Transposition in the pressure - compression factor (ρ/ρ0) plane of the data displayed on the top image. Other previous data on water23,24,27 and on synthetic Uranus21 are shown.