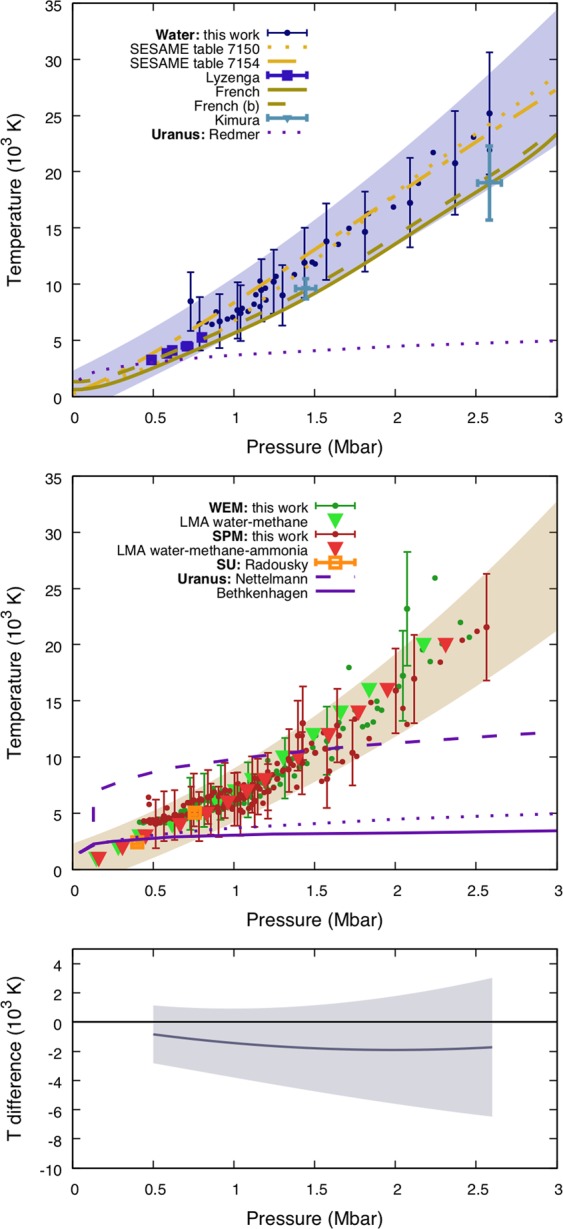
Figure 3.

From top to bottom: temperature - pressure relation for pure water (blue data) along the principal Hugoniot curve; the same relation for the WEM (green data) and the SPM (red data); temperature difference between the fit on mixtures and the fit on pure water. Each filled circle is a time-resolved measure during the propagation of a decaying shock. Each area corresponds to the error bars of the associated fit. Previous studies of pure water24,27,46,54 and synthetic Uranus21 are shown for comparison. Different Uranus interior models20,52,53 are shown in purple.
