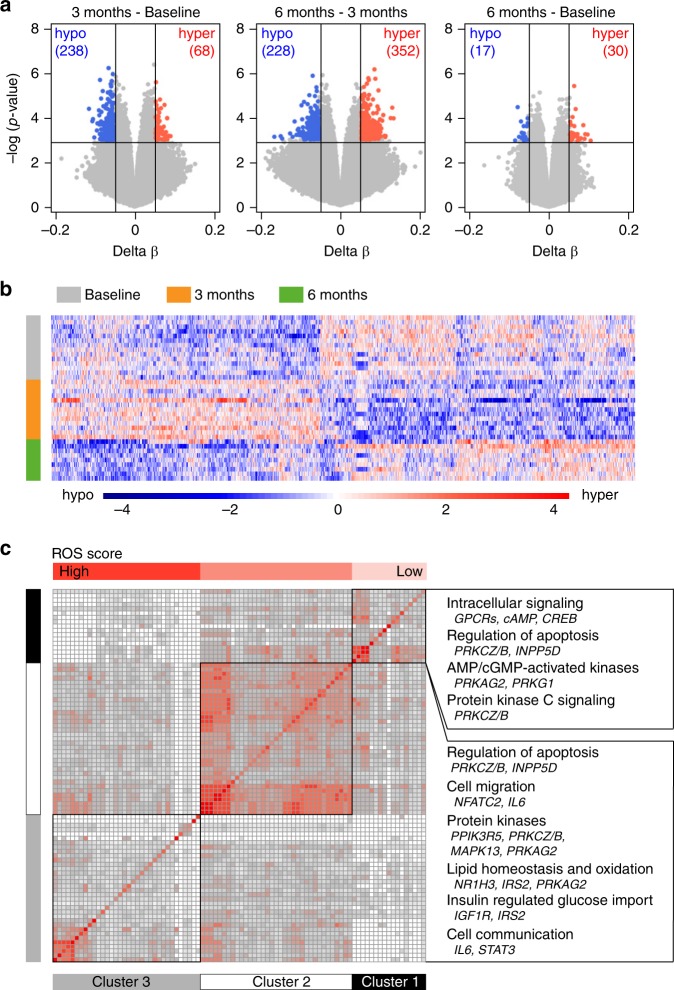
Fig. 3.
Monocytes undergo DNA methylation changes at three months. a DNA methylation was measured using Illumina EPIC arrays in CD14+ monocytes sorted from peripheral blood of RRMS patients before (baseline; BL, n = 14) treatment with DMF as well as three and six months following the treatment (M3 n = 12 and M6 n = 9). Volcano plots illustrating differences in DNA methylation between different time points following DMF treatment. Hyper- and hypo-methylated CpGs with min 5% methylation change and P < 0.001 (Linear model testing) are indicated in red and blue, respectively. b Heat map of 1614 most significant differentially methylated CpG sites between the time points (the scale represents z-score). c Clusters of canonical pathways, derived using Ingenuity Pathway Analysis, suggest functions that are affected in monocytes following DMF treatment. The significance of pathways was determined with the right-tailed Fisher’s exact test (P < 0.05) and the clustering was performed on the relative risk for the overlap of molecules between the pathways using k-means. The horizontal top bar indicates the degree of overlap with selected ROS genes. Summary of the key functions and their constituent genes that displayed changes in DNA methylation upon DMF treatment are given to the right

