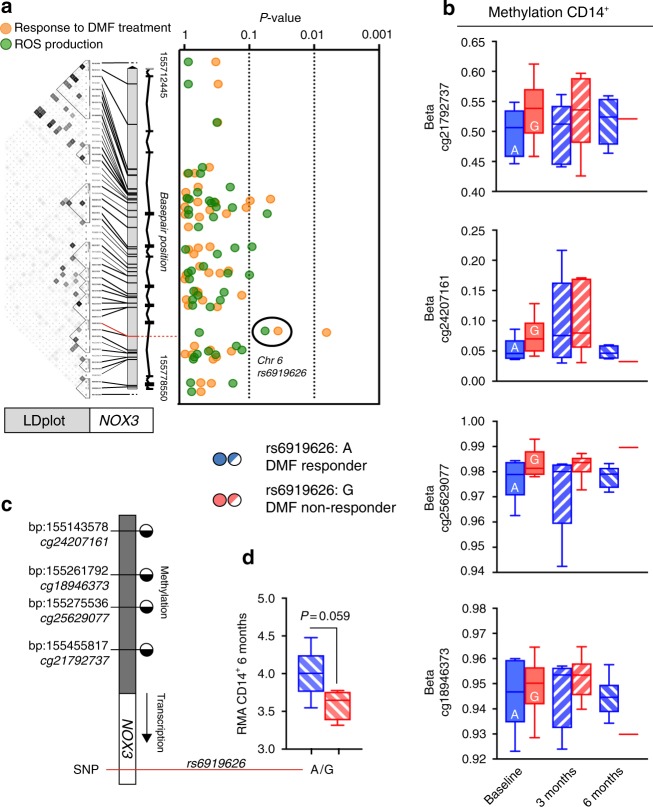
Fig. 4.
Genetic association with SNPs in NOX3 to ROS generation and response to DMF treatment. a The G allele of rs6919626 (red line) was suggestively associated with reduced ROS generation in monocytes after ex vivo stimulation with E. coli (P = 0.057, β = −0.28) and significantly associated with lack of response to DMF treatment (P = 0.036, OR = 1.57). The Linkage Disequilibrium (LDplot) of the markers in NOX3 was generated with HaploView4.2 in the Swedish population. Darker gray indicates higher r2 between markers. b Methylation in four CpGs in the NOX3 promotor region over time and between responders (A allele) and non-responders (G allele) (Baseline: n = 6 + 6, three months: n = 5 + 6, six months: n = 6 + 1). c Schematic illustration indicating methylated or unmethylated CpGs in the NOX3 promotor region. d NOX3 transcription in responders and non-responders at six months following DMF (n = 5 + 4). Analysis performed using Welch’s two-tailed t test. Graph (b, d) shows box-and-whisker plots indicating values outside the 5–95 percentile are indicated as dots

