Figure 6.
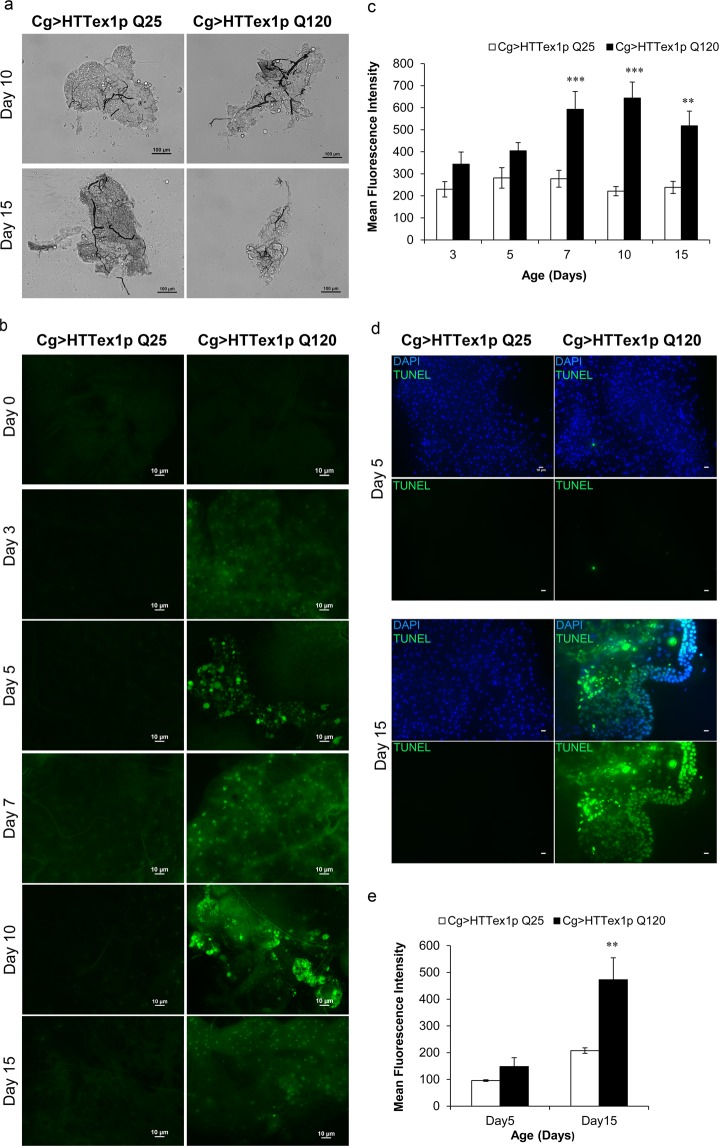
Cell death in the abdominal FB cells of 120QHTTex1 adults. (a) Representative bright-field images of abdominal FB from day10 and day15 old 25QHTTex1 and 120QHTTex1 females show dramatically degenerated FB in 120QHTTex1 females. Scale bar, 100 µm. (b) Acridine orange (AO) staining was performed on live abdominal FB tissue of both 25QHTTex1 and 120QHTTex1 females throughout the indicated ages (day0-day15). AO positive regions, an indication of cell death, are visible as bright spots (green) of higher intensity throughout the FB in 120QHTTex1 flies. Abdominal FB of 120QHTTex1 flies shows fewer AO positive regions at day5 while a dramatic increase in the proportion of AO positive areas is observed afterwards till day10 of age. At day15, AO signal is slightly reduced than day10 with severe FB degeneration. (n = 6–8/genotype/age) Scale bar, 10 µm. (c) Histogram representing the mean fluorescence intensity (measured in arbitrary units) of AO in abdominal FB of 25QHTTex1 and 120QHTTex1 females. (d) Visualisation of cell death in abdominal FB from 5- and 15- days old 25QHTTex1 and 120QHTTex1 females by TUNEL labelling. TUNEL-positive cells are stained green and nuclei are labelled with DAPI. TUNEL-positive cells are detected in large amounts in the FB of day15 old 120QHTTex1 adults. 25QHTTex1, however, do not show TUNEL-positive cells. (n = 8–10/genotype/age) Scale bar, 10 µm. (e) Histogram representing the mean intensity of TUNEL signal (green; measured in arbitrary units) in abdominal FB of 25QHTTex1 and 120QHTTex1 females. Values represent mean ± SEM. *** P < 0.001; **P < 0.01.

