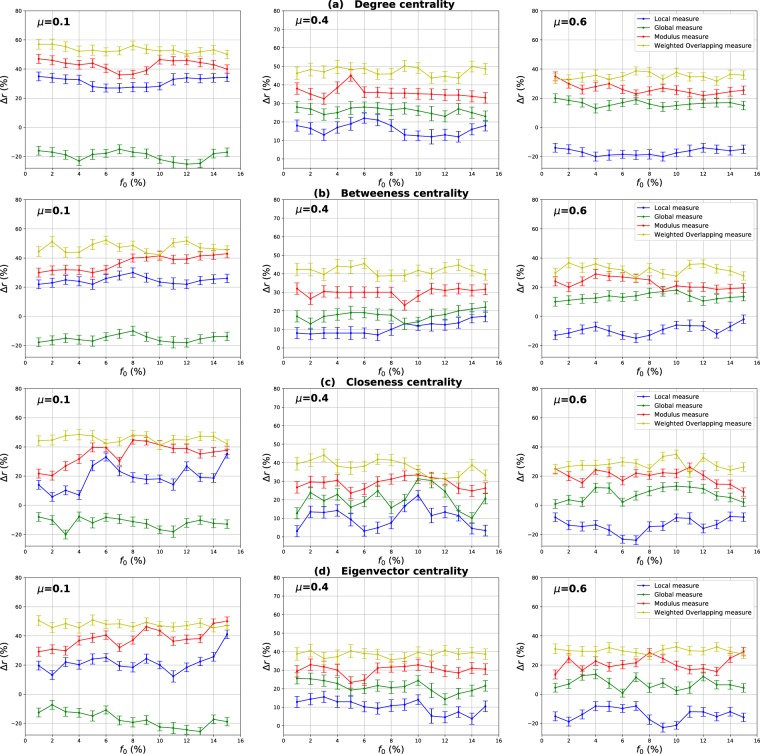
Figure 3.
Relative difference of the outbreak size Δr versus the percentage of initial spreaders f0, where , Rc and Rs are the final number of recovered nodes for the centrality measure under test and the standard centrality, respectively. The Degree (a), Betweenness (b), Closeness (c) and Eigenvector (d) centrality measures are compared to their extensions derived from the Overlapping Modular Centrality. Synthetic networks generated by the LFR algorithm with different community structure strength are used (the value of their mixing coefficient is equal to 0.1, 0.4 and 0.6). We set the proportion of overlapping nodes on to 10% of the size of the network and the community membership om to 10% of the total number of communities. Each value on the curves is obtained by averaging the results of 200 SIR simulations per method and fraction of initially infected nodes. Δr is positive if the centrality under test is more effective than the standard centrality.

