Fig. 1.
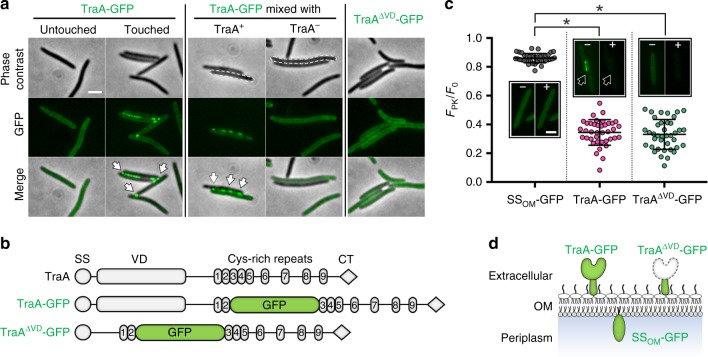
TraA receptors cluster at cell–cell contact interfaces. a The formation of TraA-GFP foci (arrows) requires direct contacts between traA+ cells. b Domain architectures of TraA and constructed variants used in (a). SS, type I signal sequence; VD, variable domain; CT, MYXO-CTERM. c Cell surface localization of TraA fusion proteins revealed by PK accessibility assay. Arrows highlight the disappearance of TraA-GFP foci after PK treatment. Effects were quantified by comparing fluorescence of PK-treated cells relative to that of the same cells before treatment. SSOM-GFP is a control localized on the periplasmic side of the OM. FPK (fluorescence intensity of whole cells after PK treatment); F0 (fluorescence intensity before PK treatment). Representative images of cells before (−) and after (+) PK treatment are shown. Error bars represent standard deviation from the mean (n = 39 in each case). Significant differences are indicated with asterisks (p < 0.05; t-test). d Schematic of localization results from (c). See Supplementary Table 1 for strain details. Scale bar = 1 µm. Source data are provided as a Source Data file

