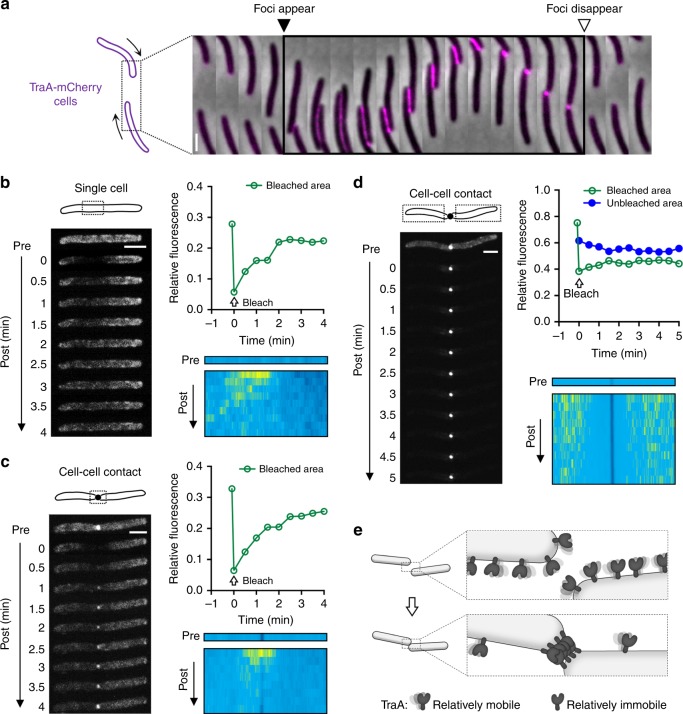
Fig. 2.
Dynamics of TraA receptors at the cell surface. a A representative time series of interactions between two cells bearing TraA-mCherry. Time interval between frames was 30 s. b–d FRAP analyses of TraA-GFP fluidity on the cell surface. Representative FRAP images are shown. Relative fluorescence measures the ratio of fluorescence intensity of the bleached areas (indicated with dashed borders) to that of the whole cells before and after photobleaching. TraA-GFP fluorescence intensity profiles along the long axes of analyzed cell(s) before and after photobleaching are shown as kymographs. Blue, high intensity; yellow, low intensity. e A model illustrating how TraA mobility changes upon cell–cell contact. Scale bar = 1 µm. Source data are provided as a Source Data file

