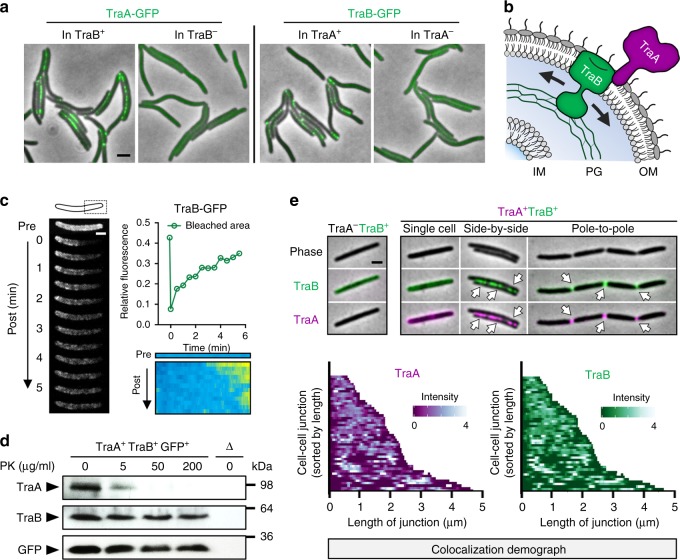
Fig. 4.
TraA and TraB form dynamic adhesins at intercellular junctions. a Clustering of TraA or TraB at cell–cell contacts requires the presence of both proteins. Scale bar = 1 µm. b A schematic of the TraA/B adhesin complex in the cell envelope. To explain its mobility, TraB likely slides along or is transiently bound to peptidoglycan (PG). IM, inner membrane. c Representative FRAP analysis of TraB-GFP fluidity in the OM done as described in Fig. 2 legend. Scale bar = 0.5 µm. d Immunoblot analysis of a strain expressing TraA, TraB, and SSOM-GFP treated with different concentrations of PK. The same samples were probed with anti-TraA serum, anti-TraB serum, or anti-GFP antibody. A strain lacking TraA, TraB, and SSOM-GFP (indicated as an open triangle) was used as a negative control. e Colocalization of TraA and TraB at contact interfaces. TraA was labeled with primary TraA antibodies and a secondary Alexa Fluor 594−conjugated antibody. A TraA−TraB+ strain was used as a negative control for TraA immunofluorescence (left). TraB was tagged with GFP. Demographs display a collection of 48 fluorescence profiles of TraA and TraB at cell–cell contact interfaces, sorted from the shortest to the longest junctions. Scale bar = 1 µm. Strain details are in Supplementary Table 1. Source data are provided as a Source Data file

