Figure 1.
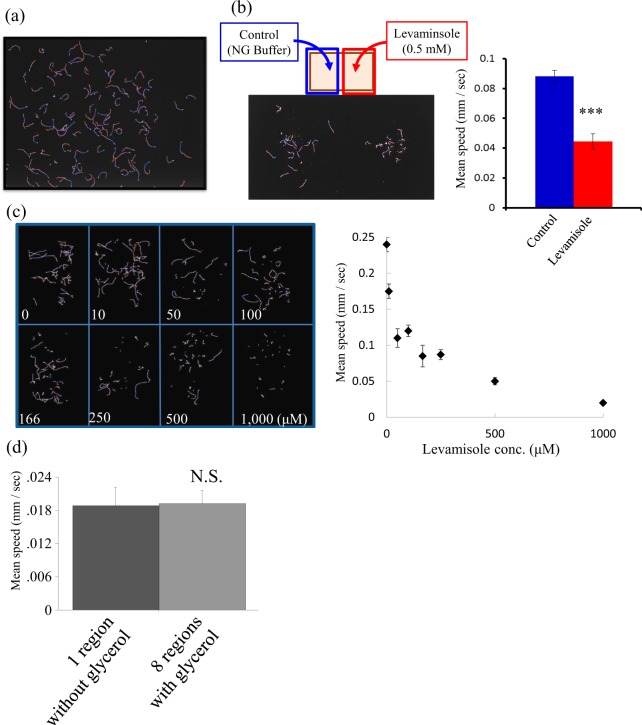
Optimization of the drug-screening system using Multi-Worm Tracker (MWT) (a) A representative trajectory of an N2 worm for 30 sec. A 13 × 10 cm agar-filled plate was used for the assay, and images were captured using Toshiba-Teli Ultra-High-resolution 12 M pixel CMOS sensor camera-link camera. The locomotion of as much as about 500 worms can be detected and analyzed simultaneously. (b) Performance of the MWT assay for detection of levamisole treatment. Control worms treated with NG buffer only were placed on the left side of the assay plate (blue line, n = 18) and levamisole (0.5 mM) on the right side (red line n = 20). The average moving speed of each group was analyzed and quantified using Choreography. (c) The WMT assay is divided into 8 groups. To analyze multiple groups of worms simultaneously, assay plates were divided into 8 regions by glycerol. A representative trajectory of worms treated by different concentrations of levamisole is shown. The average moving speeds analyzed by Choreography are shown on the right side. (d) A comparison of the locomotion speed of the worms with and without separation into regions by glycerol The statistical analyses in b and d were performed using the Student t-test (***p < 0.0001).

