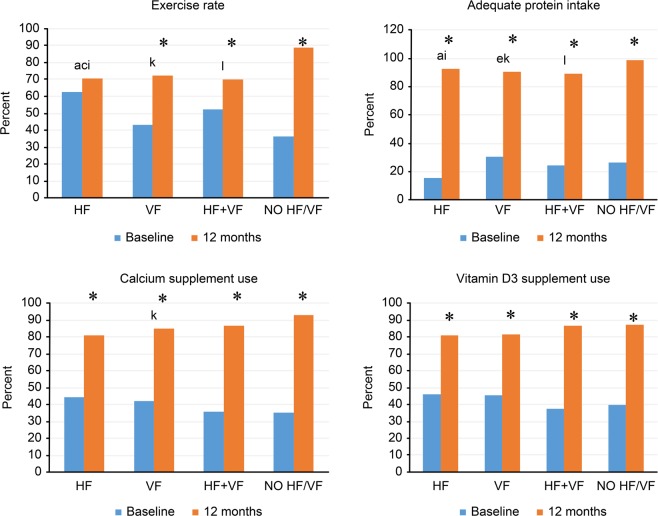
Figure 3.
Secondary outcomes of participants grouped according to fracture types. *After intervention, there were significant difference between baseline and 12-month in exercise rate, adequate protein intake, calcium and vitamin D3 supplement use. Post hoc analysis with Fisher’s least significant difference was applied to compare group difference. The P value was 0.0083 for significance group difference. Significant between group difference was demonstrated by alphabet. For exercise rate of baseline assessment, a: significant difference from “HF” and “VF” (P < 0.001); c: significant difference from “HF” and “NO HF/VF” (P < 0.001). For exercise rate of 12-month assessment, i: significant difference from “HF” and “NO HF/VF” (P < 0.001); k: significant difference from “VF” and “NO HF/VF” (P < 0.001); l: significant difference from “HF + VF” and “NO HF/VF” (P < 0.001). For adequate protein intake of baseline assessment, a: significant difference from “HF” and “VF” (P < 0.001); e: significant difference from “VF” and “NO HF/VF” (P < 0.001). For adequate protein intake of 12-month assessment, i: significant difference from “HF” and “NO HF/VF” (P < 0.001); k: significant difference from “VF” and “NO HF/VF” (P < 0.001); l: means significant difference from “HF + VF” and “NO HF /VF” (P < 0.001). For calcium supplement use in 12-month assessment, k: significant difference from “VF” and “NO HF/VF” (P = 0.0065).

