Fig. 6.
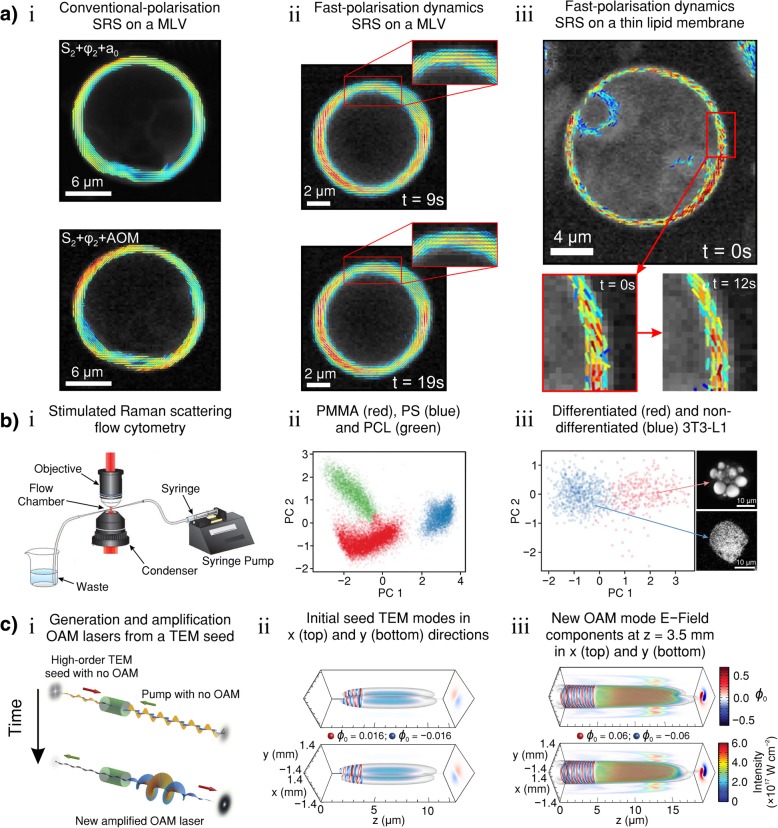
a Comparison of conventional and fast-polarisation SRS on multi-lamellar lipid vesicles (MLVs). a i–iii the composite images show absolute local molecular order (S2) and mean molecular orientation (φ2) values represented as coloured sticks. a i (top) Conventional polarisation SRS on a MLV using step angles of 5° (acquisition time 112 s); the total measured intensity (a0) is represented as a grey-scaled background. a i (bottom), fast-polarisation SRS on the same MLV (acquisition time 1 s); the acousto-optic modulation (AOM) is shown as a grey-scaled background. a ii Fast-polarisation dynamics SRS images of lipid order in a MLV taken at different times of the observation sequence shown; the AOM is shown as a grey-scaled background. Zoomed regions at the upper part of the MLV contour show no change in lipid order during the measurement over tens of seconds. a iii Fast-polarisation dynamics of lipid order in a thin lipid membrane. Coloured sticks show S2 and φ2 and the grey-scale background shows the AOM amplitude. b i SRS flow cytometry (SRS-FC) setup. b ii Colour-coded constrained principle component analysis (CPCA) scatter plot of SRS-FC spectra from mixed PMMA (red), PS (blue) and PCL (green) beads. The principle components (PC 1 and PC 2) are distinguished subpopulations of mixed polymer beads according to the distinct Raman spectra. Data were acquired in 6 s using a bead mixture with a concentration of 2% solids. The beads were 10 μm in diameter. b iii (left) Colour-coded CPCA scatter plot from SRS-FC analysis of lipid amount in 3T3-L1 cells with principle components differentiated through quantification of distinct chemical compositions inside single cells. Data were acquired in 3 s. b iii (right) SRS images of the two 3T3-L1 cell types. c i Illustration of the generation and amplification of a new orbital angular momentum (OAM) laser in a configuration with no initial OAM using a Hermite-Gaussian (TEM) laser. c ii, iii Simulation of the generation and amplification of a new OAM mode from initial configurations with no net OAM. c ii The initial seed TEM modes in x- and y-directions (top and bottom, respectively). c iii The new OAM mode electric field components at z = 3.5 mm in x- and y-directions (top and bottom, respectively). The new mode is linearly polarised in the x- and y-directions with l1x = l1y = − 1 from an initial seed polarised in the x-direction with a TEM01 mode and in the y-direction with a TEM10 mode that is π/2 out of phase with respect to the TEM01 mode polarised in x. The pump is a Gaussian laser polarised at 45°. Projections in the (x,y) plane (blue-white-red) show the normalised vector potential (ϕ0) field envelope of the new OAM mode at the longitudinal slice where the laser intensity is maximum. The envelope of the 3D laser intensity is also shown in blue-green-red colours and normalised vector potential isosurfaces in blue and red. The values of the laser vector potential illustrated by the isosurfaces are shown in c (ii) and c (iii). a reproduced with permission from the OSA [259]. b reproduced with permission from the OSA [260]. c Adapted from [46] and licenced under CC BY 4.0.

