Figure 4.
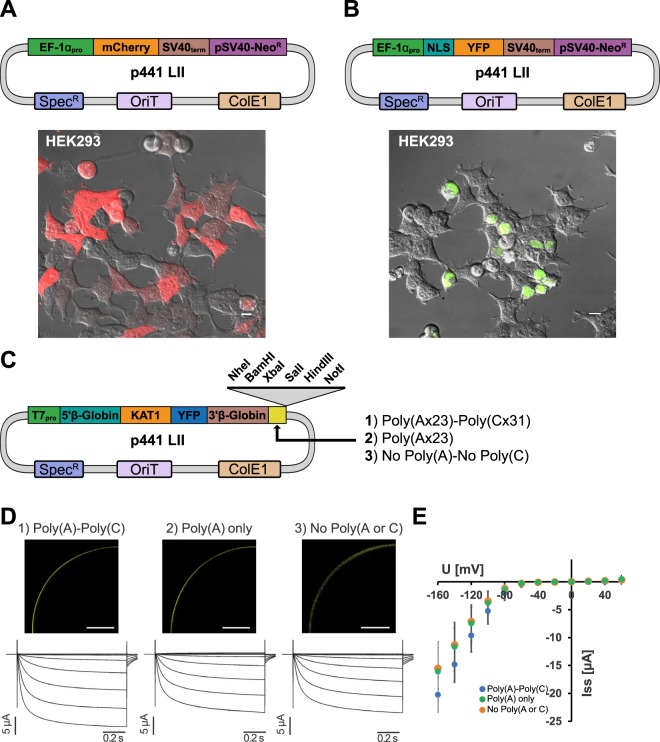
Characterization of MK components in human cells and Xenopus oocytes. Image overlays (fluorescence and DIC) of HEK293 cells transfected with LII reporter plasmids expressing mCherry (A) and NLS-YFP (B) driven by the ELF-1α promoter. (C) Construct design for functional expression of the KAT1 K+ channel in Xenopus laevis oocytes. Three independent DNA sequences placed downstream of the β-Globin 3′UTR were tested in parallel to monitor their effect on channel expression. Unique enzyme sites for plasmid linearization prior to cRNA synthesis are shown. (D) Upper panel: Confocal fluorescence images of oocytes injected with KAT1-YFP cRNA followed by the 3′ sequences shown in (B) (scale bars: 200 μm). Lower panel: Current voltage curves and representative current traces of oocytes micro-injected with KAT-YFP cRNA as indicated. (E) Steady state currents for the corresponding curves in (D). Shown are the measurement means and standard deviations. Voltage steps ranged from +60 mV to −160 mV in 20 mV decrements. Holding potential was set to −40 mV. Scale bars in (A) represent 10 µm and 200 µm in (D).

