
Figure 6.
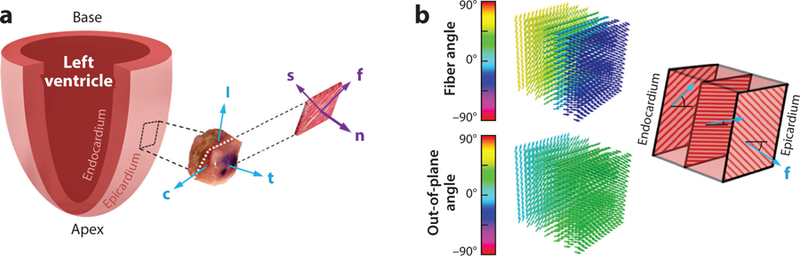
(a) Schematic representation of the fiber–sheet–normal microstructure. The mean myofiber direction is denoted by the vector f, the direction transverse to the fiber axis within the layers is denoted by s, and the direction normal to the layers is denoted by n. (b) Model of the heart wall as a layered structure, with each layer exhibiting transverse isotropy. Other vectors: c, circumferential direction; l, longitudinal direction; t, transmural direction. Panel a inspired by Reference 79. Panel b inspired by Reference 80.