
Fig. 3.
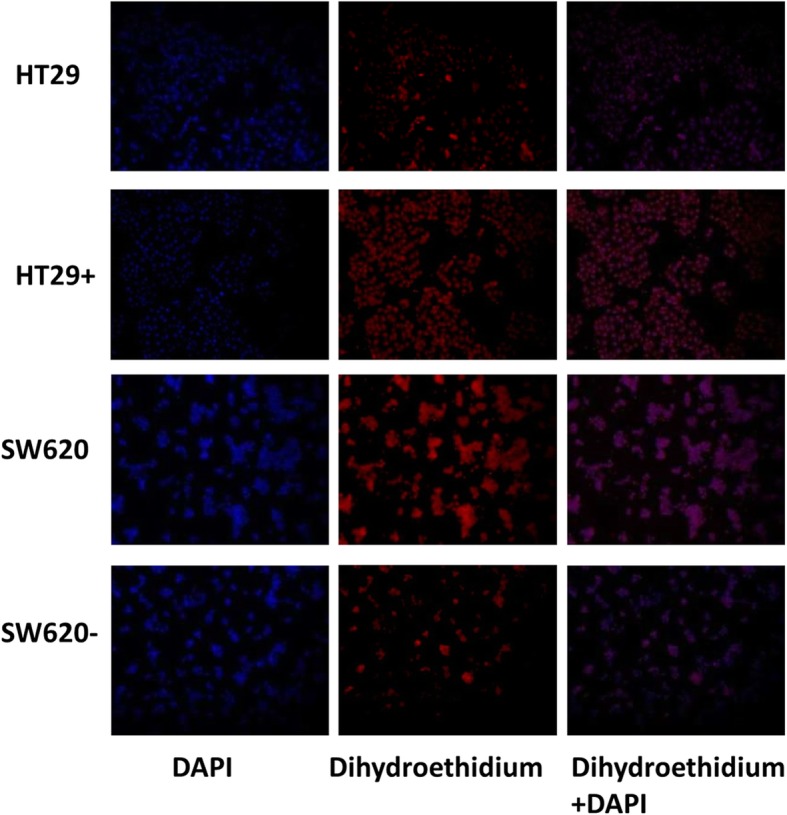
Detection of the ROS levels. Levels of ROS in HT29 SREBP1oe, and SW620 SREBP1kd cells along with that of control cells was examined with dihydroethidium. (HT29 SREBP1oe that over-expressed SREBP1 in the HT29 cell line is represented by HT29+, SW620 SREBP1kd that had stably knocked down SREBP1 in the SW620 cell line is represented by SW620-)