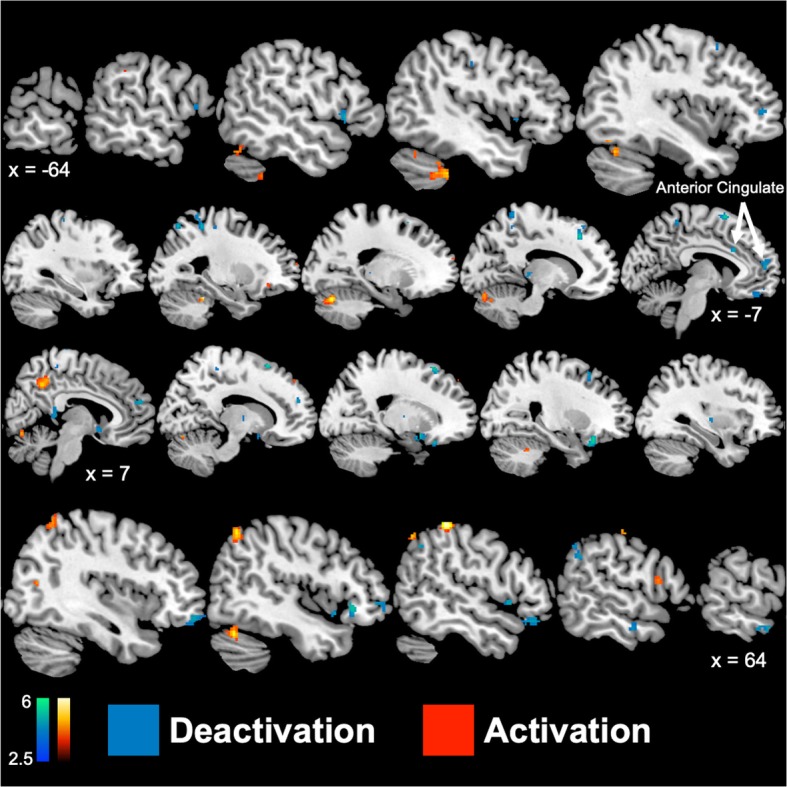
Fig. 3.

Sagittal brain slices representing greater (p < 0.005) cerebral blood flow increases (activation; red) and decreases (deactivation; blue) during mental stress compared to control tasks in women (n = 9) versus men (n = 35) with coronary artery disease and mental stress induced myocardial ischemia using [15O]H2O positron emission tomography. Values below brain denote Talairach x-coordinates, where positive and negative values correspond to the right and left hemisphere, respectively. Color bars indicate Z values of activation or deactivation
