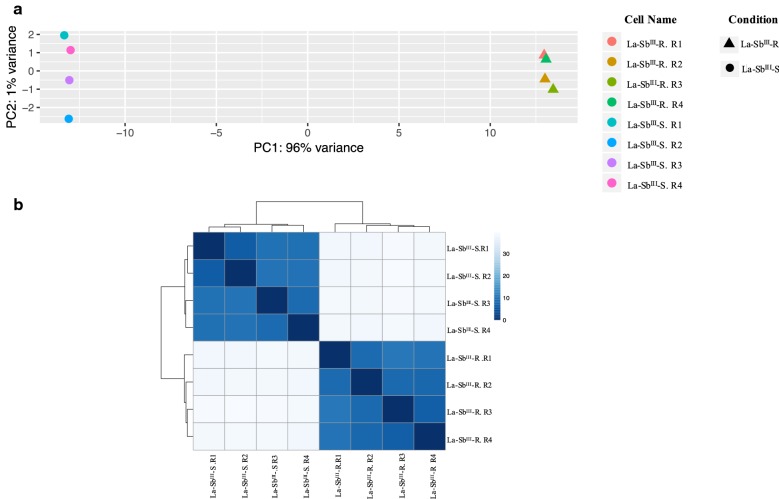
Fig. 1.
La-SbIII-S and La-SbIII-R lines discriminations. a Principal component analysis based on the variant stabilized counts from four individual replicates (La-SbIII-S and La-SbIII-R). b Hierarchical clustering analysis, which was based on data from four individual replicates (La-SbIII-S and La-SbIII-R lines) and plotted using the pHeatmap R package (https://cran.r-project.org/). Stronger relationships between variables are indicated by shorter distances in the dendrograms and darker blue color in the heatmap

