Fig. 1.
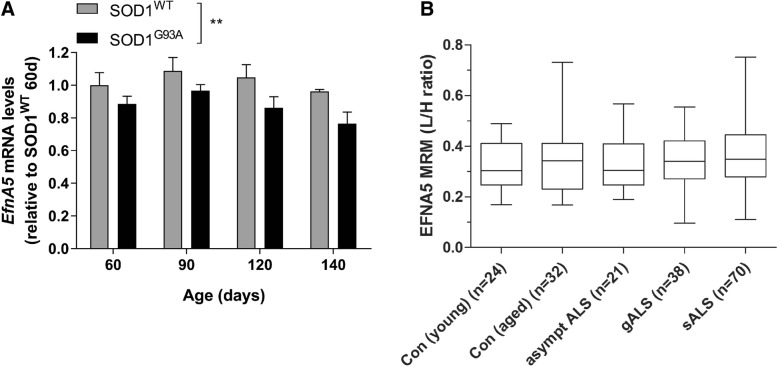
EfnA5 gene expression levels are reduced in SOD1G93A mice whereas efnA5 protein is not altered in ALS patients CSF. a EfnA5 gene expression was determined in the lumbar spinal cord of SOD1WT and SOD1G93A overexpressing mice (N = 4–9). Data represents mean ± SEM, and different conditions were compared with a two-way ANOVA with Tukey’s multiple comparisons test: ** P < 0.01 as compared with SOD1WT. b EfnA5 protein relative quantification in the CSF of patients carrying an ALS genetic known mutation (gALS) and patients without any known mutation (sALS) were compared to the levels found in the CSF of young and aged controls (Con) and asymptomatic ALS patients carrying a known mutation for the disease (asympt ALS). Boxes show median and interquartile range, and whiskers are minimum and maximum. The light-to-heavy (L/H) peptide ratio was used as relative quantification of EfnA5 protein

