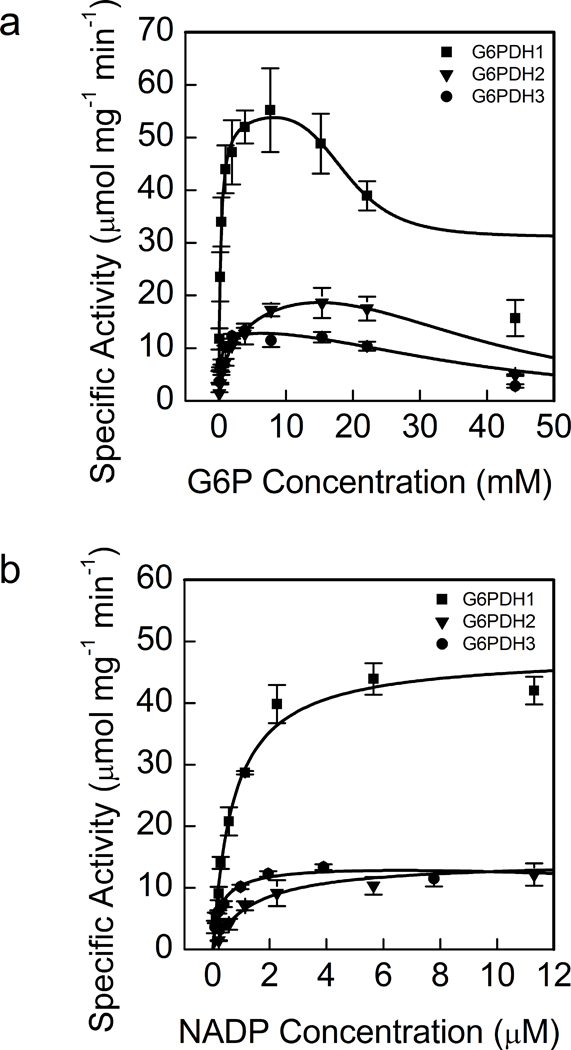
Fig 1. Activity of G6PDH1, 2, and 3 at different G6P (a) and NADP+ (b) concentrations.

Each data point represents mean and error bars represent S.E. (n=3). All three isoforms of oxidized G6PDH showed substrate inhibition for G6P. G6PDH1 and 3 showed the greatest affinity for G6P and G6PDH3 had the greatest affinity for NADP+. During the G6P experiments NADP+ was 0.6 mM and during the NADP+ experiment assays were done 7.6 mM G6P for G6PDH1 and 3 and 15.4 mM for G6PDH2 since these were approximately the concentrations that gave maximal activity for each enzyme. In (a) lines represent data fit to Eq. 2 and in (b) lines represent data fit to the Michaelis-Menten equation.
