
Figure 5. Effects of HN2 on progression of A549 cells through the cell cycle.
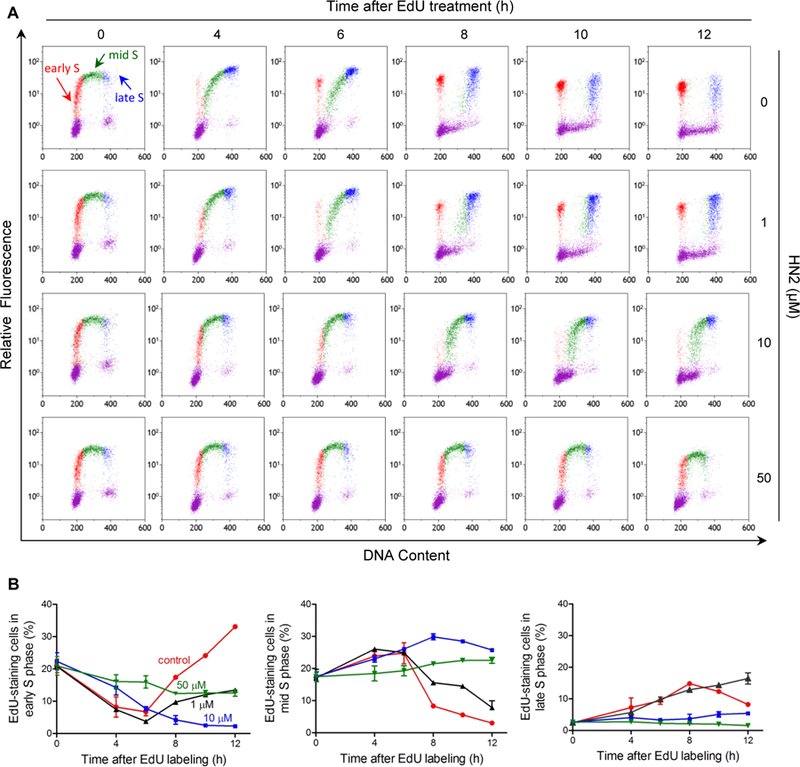
(A) EdU pulse-chase assay. Cells were treated with HN2 (10 or 50 µM) or vehicle control in serum-free medium at 37ºC for 30 min followed by 5-ethynyl-2’-deoxyuridine (EdU; 40 µM). After 30 min, cells were refed with complete growth medium without HN2 or EdU. At the indicated times, cells were harvested. EdU labeled cells were detected using a click reaction with Alexa Fluor 488 azide. Following DNA staining with FxCycle™ Violet, cells were analyzed by flow cytometry. Panels show representative two parameter histograms from one of three independent experiments. DNA content is shown on the x-axis (FxCycle™ Violet fluorescence) and DNA synthesis is shown on the y-axis (EdU fluorescence). Cells with no or very low EdU fluorescence, representing cells in G0/G1 and G2/M, are shown in purple. Cells with high EdU fluorescence, representing cells in S-phase, are divided into three groups based on the DNA content: cells with 2N DNA content (early S) are shown in red, cells with 4N DNA content (late S) are shown in blue, and cells with DNA contents in between 2N and 4N (mid S) are shown in green. (B) Percentage of EdU-positive cells in the S phase of the cell cycle.