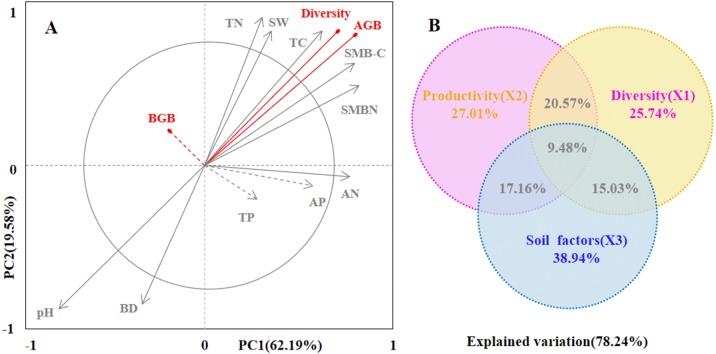
Figure 6. The driving factors of plant diversity and productivity.
Redundancy analysis (RDA) showing the relationships between soil factors and productivity and diversity (A). In the biplot, productivity and diversity are highlighted in red, and soil factors are in gray. Each arrow represents the eigenvector corresponding to an individual variable. PC1 accounted for 62.19% of the overall variance, and PC2 accounted for 19.58% of the overall variance. The results of the generalized additive models (GAMs) for plant productivity and diversity (B). The GAMs analyses led to the following fractions: pure effect of productivity; pure effect of diversity; pure effect of soil factors; joint effects of productivity, diversity and soil factors; and ex plained variation.Soil factors (SW-soil water content, BD-bulk dens ity, EC-electrical conductivity, pH-pH value, TC- total carbon , TN-total nitrogen, TP-total phosphorus, AP-available phosphorus, AN-available nitrogen, SMB-C-soil microbial biomass carbon, SMB-N-soil microbial biomass nitrogen) are represented as arrows, and the strength of their impacts is directly proportional to the length of the arrow lines.

