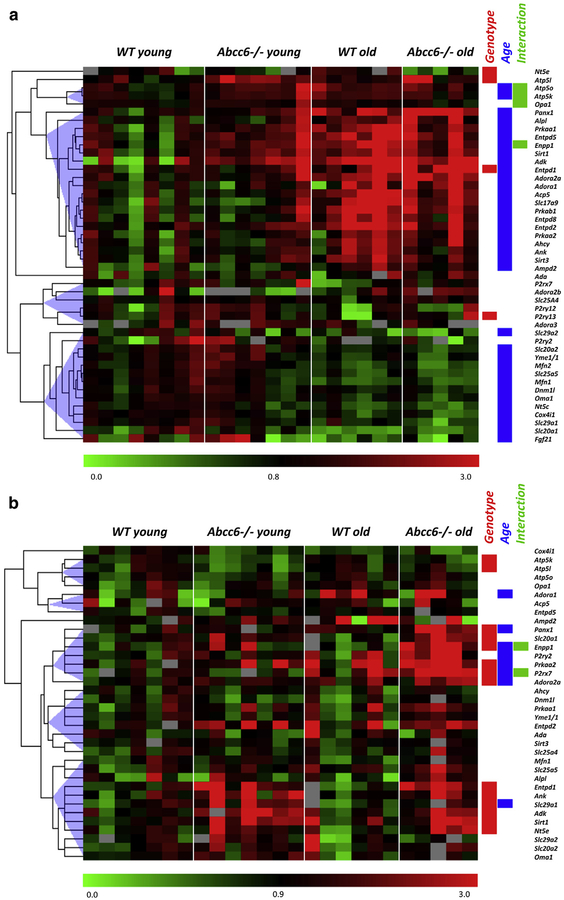
Figure 3. Gene expression pattern in liver and aorta of Abcc6−/− mice.
Heat map of gene expression in the (a) liver and (b) aorta of young (5 months, n = 7) and old (24 months, n = 6, except for Abcc6−/−aorta, for which n = 5) Abcc6+/+ and Abcc6−/− mice. Results represent color-coded expression relative to the control group (WT young). On the right are noted genes that are differently expressed (P < 0.05, two-way analysis of variance) according to genotype (red box) and to age (blue box) and the significance of the interaction between the two factors (green box). WT, wild type.

