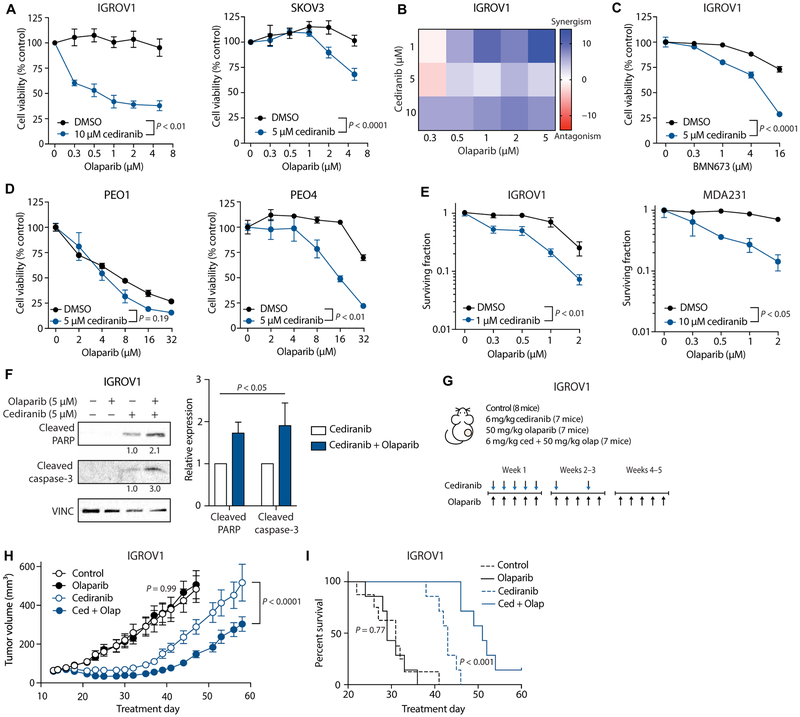
Fig. 5. Cediranib increases cancer cell sensitivity to PARP inhibition.
(A) Cell viability (as measured by ATP-based CellTiter-Glo assay) of IGROV1 and SKOV3 cells treated with or without 5 or 10 μM cediranib, as indicated, and increasing doses of olaparib (IGROV1: two-way ANOVA, interaction P < 0.01, n = 3 biological replicates; SKOV3: two-way ANOVA, interaction P < 0.0001, n = 5 biological replicates). (B) Bliss synergism analysis of IGROV1 cells treated with varying doses of cediranib and olaparib. (C) Cell viability of IGROV1 cells treated with or without 5 μM cediranib, as indicated, and increasing doses of BMN673 (two-way ANOVA, interaction P < 0.0001; n = 3 technical replicates). (D) Cell viability of PEO1 (BRCA2-deficient) and PEO4 (BRCA2-proficient) cells treated with or without 5 μM cediranib, as indicated, and increasing doses of olaparib (PEO1: two-way ANOVA, interaction P = 0.19, n = 3 technical replicates; PEO4: two-way ANOVA, interaction P < 0.001, n = 3 technical replicates). (E) Clonogenic survival of IGROV1 and MDA231 cells treated with or without 1 or 10 μM cediranib, as indicated, and increasing doses of olaparib (IGROV1: two-way ANOVA, interaction P < 0.01, n = 6 technical replicates; MDA231: two-way ANOVA, interaction P < 0.05, n = 3 technical replicates). (F) Western blot of apoptotic markers in IGROV1 cells treated with 5 μM cediranib and/or 5 μM olaparib (two-way ANOVA, cediranib versus cediranib + olaparib, P < 0.05; n = 3 independent experiments). (G) Treatment plan for mouse tumor growth and survival study (n = 1 experiment). (H) Growth curves of IGROV1 xenograft tumors in control mice and mice treated with olaparib (50 mg/kg) and/or cediranib (6 mg/kg) (control versus olaparib: two-way ANOVA, interaction P = 0.99, control n = 8, olaparib n = 7 mice; cediranib versus cediranib + olaparib: two-way ANOVA, interaction P < 0.0001, n = 7 mice). (I) Kaplan-Meier plot of survival of mice from tumor growth experiment, with survival cutoff criteria defined as tumor volume greater than three times that at initial treatment [log-rank (Mantel-Cox) test: control versus olaparib, P = 0.77; cediranib versus cediranib + olaparib, P < 0.001]. Data are represented as means ± SEM. Numbers below Western blot panels represent relative quantification of the respective bands normalized to loading control by densitometry.

