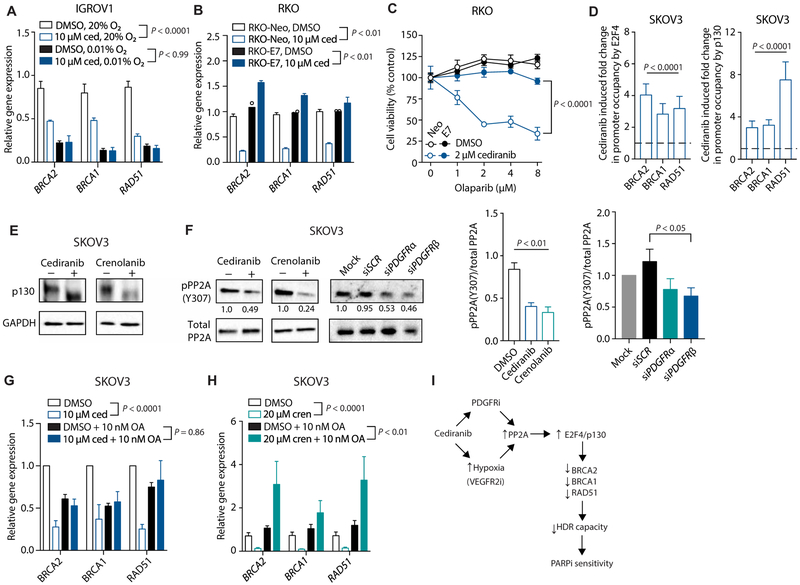
Fig. 7. Cediranib suppresses HDR factor expression through activation of PP2A and E2F4/p130.
(A) Relative gene expression of HDR factors in IGROV1 cells treated with DMSO or 10 μM cediranib under normoxic (20% O2) or hypoxic (0.01% O2) conditions (two-way ANOVA, effect of cediranib: normoxia, P < 0.0001; hypoxia, P > 0.99; n = 3 biological replicates). (B) Relative gene expression of HDR factors in control and E7-expressing RKO cells treated with 5 μM cediranib compared to DMSO control (two-way ANOVA, effect of cediranib: RKO-Neo, P < 0.01; RKO-E7, P < 0.01; n = 2 to 3 biological replicates). (C) Cell viability (as measured by ATP-based CellTiter-Glo assay) of control and E7-expressing RKO cells treated with or without 2 μM cediranib, as indicated, and increasing doses of olaparib (two-way ANOVA, RKO-Neo 2 μM cediranib versus RKO-E7 2 μM cediranib, P < 0.0001; n = 3 technical replicates). (D) ChIP analysis of E2F4 and p130 occupancy at HDR promoters in SKOV3 cells after cediranib treatment compared to controls (two-way ANOVA, effect of cediranib: E2F4, P < 0.0001; p130, P < 0.0001; n = 5 biological replicates). (E) Western blot of p130 in SKOV3 cells after treatment with cediranib and crenolanib compared to controls (n = 3 technical replicates). (F) Western blot of phosphorylated and total PP2A in SKOV3 cells after treatment with cediranib, crenolanib, or siRNA against PDGFRα or PDGFRβ, as indicated (one-way ANOVA, inhibitors: P < 0.01; DMSO versus cediranib, P < 0.001; DMSO versus crenolanib, P < 0.001; DMSO, n = 5; crenolanib and cediranib, n = 3 technical replicates; siRNAs, P = 0.11; siSCR versus siPDGFRβ, P < 0.05; n = 3 technical replicates). (G) Relative gene expression of HDR factors as measured by qRT-PCR in SKOV3 cells treated with cediranib and/or the PP2A inhibitor okadaic acid (OA) (two-way ANOVA, effect of cediranib: DMSO, P < 0.0001; okadaic acid, P = 0.86; n = 3 biological replicates). (H) Relative gene expression of HDR factors as measured by qRT-PCR in SKOV3 cells treated with crenolanib and/or okadaic acid (two-way ANOVA, effect of cediranib: DMSO, P < 0.0001; okadaic acid, P < 0.01; n = 5 to 6 biological replicates). (I) Dual mechanisms underlying cediranib-mediated suppression of HDR in vivo in tumor cells: an indirect effect via VEGFR inhibition and induction of hypoxia and a direct effect via inhibition of PDGFR signaling, both causing phosphatase PP2A activation, formation of repressive E2F4/p130 complexes, and down-regulation of HDR gene expression, as indicated. Data are represented as means ± SEM. Numbers below Western blot panels represent relative quantification of the respective bands normalized to loading control by densitometry.

