
Fig. 5.
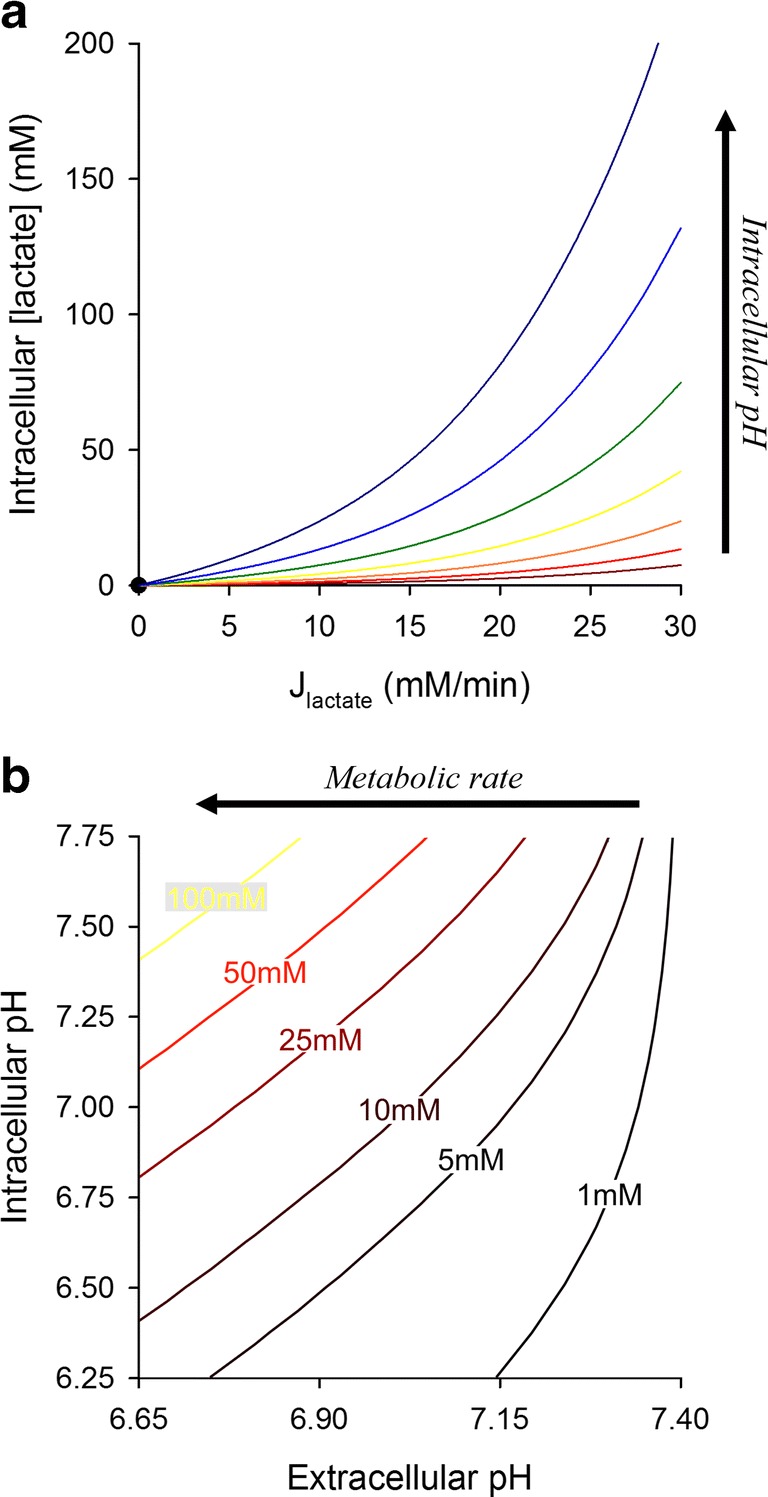
Using the mathematical model to map the relationship between pHi, pHe, and intracellular lactate. Simulations were based on the model for a glycolytic cells with high MCT and exofacial CA activity, placed 150 μm away from a capillary. pHi and lactic acid production were varied between 6.25 and 7.75, and 0 and 30 mM/min, respectively. (a) Intracellular lactate concentration as a function of metabolic lactate production rate; each line represents a different starting pHi. (b) Results replotted as a contour map. Contours show the combination of pHi and pHe that yield a particular concentration of lactate in cytoplasm. The highest degree of intracellular lactate retention is attained with high metabolic rates, when the inward pH gradient is large (i.e., pHi>pHe)