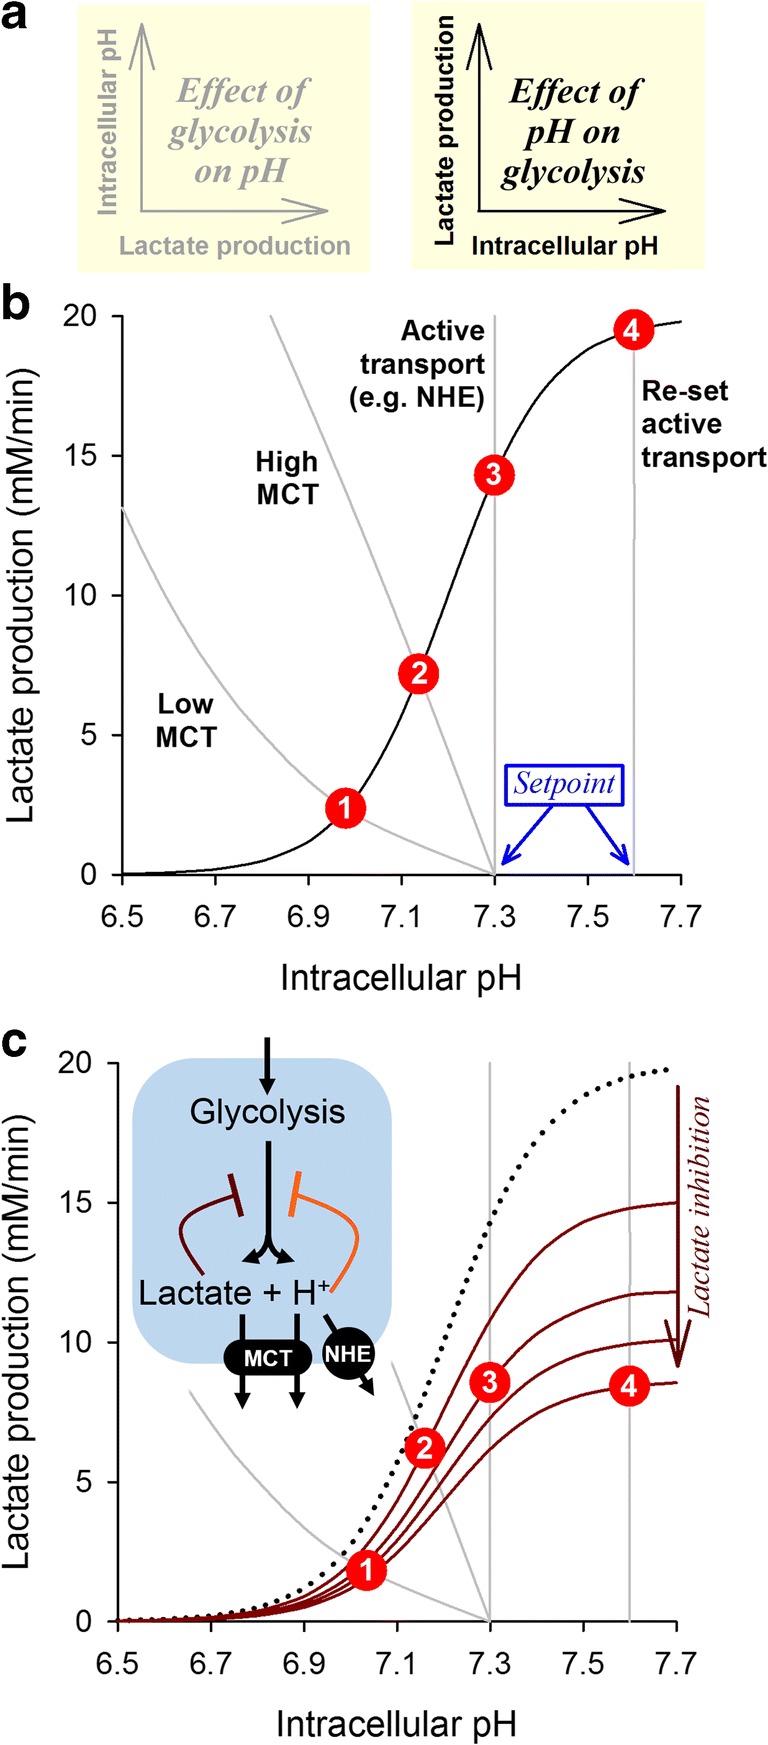
Fig. 6.

Using a graphical approach to infer steady-state pHi and metabolic rate. (a)Left: Lactate production affects intracellular pH, as described in Fig. 3 and Fig. 4. In this representation, metabolic rate is considered to be the independent variable. Right: Intracellular pH affects lactate production through the inhibition of glycolysis. In this representation, pHi is considered to be the independent variable. (b) The pHi-metabolism and metabolism-pHi relationships are akin to two equations; the mathematical solution to these can be inferred graphically from the point of crossover. Superimposing the relationship between pHi and glycolytic rate (black curve) with the relationship describing the effect of glycolytic rate on pHi (gray curve) for a cell, located 150 μm away from its nearest capillary, with high CA expression and either (1) low MCT activity, (2) high MCT activity, (3) high MCT activity and active transport with a set point of pH=7.3, or (4) high MCT activity and active transport with a set point of pH=7.6. The points of crossover (red ;circles) are the mathematical solutions of these four pairs of equations. Steady-state pHi and metabolic rate increase in tandem when MCT activity is raised and when active transport is engaged to an alkaline set point. (c) In addition to the allosteric inhibitory effect of H+ ions on glycolytic enzymes, another influence is end-product inhibition of glycolysis by the accumulation of lactate. This is expected to scale-down the pHi-metabolism curve and produce a different crossover point, particularly at high pHi when lactate accumulation is expected to be substantial. In the example illustrated (assuming an inhibitory constant Ki of 10 mM for lactate), the inhibitory effect produced by intracellular lactate retention at pHi > 7.3 offsets the disinhibition of glycolysis by low [H+]; consequently, the highest possible metabolic rate is attained in the range 7.1–7.3
