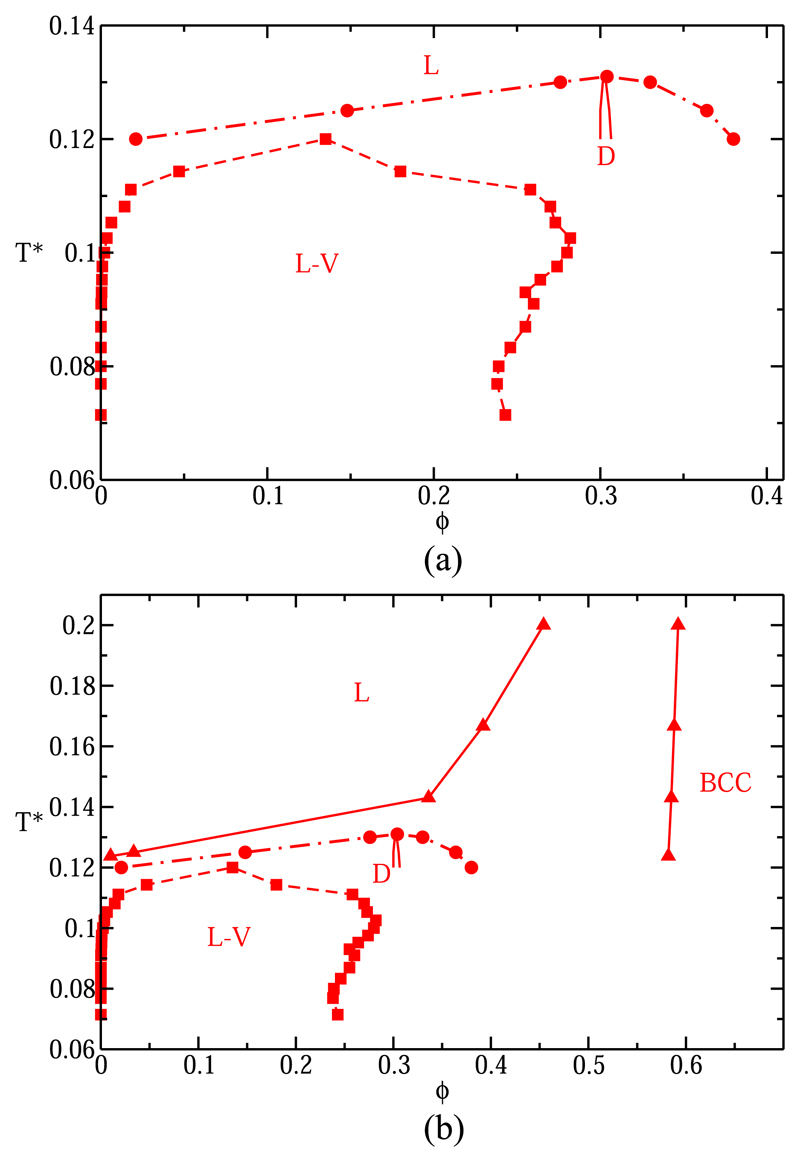
Fig. 12.
T*–ϕ diagram for the p-p four-patch colloid. L-V equilibrium is represented by squares joined by dashed lines. In (a), liquid packing fractions for the liquid-diamond transition are represented by circles, and the thick continuous line accounts for the diamond packing fraction at coexistence conditions. (b) The same as in (a) but also considering the coexistence packing fractions along the freezing line between liquid and BCC (triangles).

