
Figure 5. Quantitative viability test results.
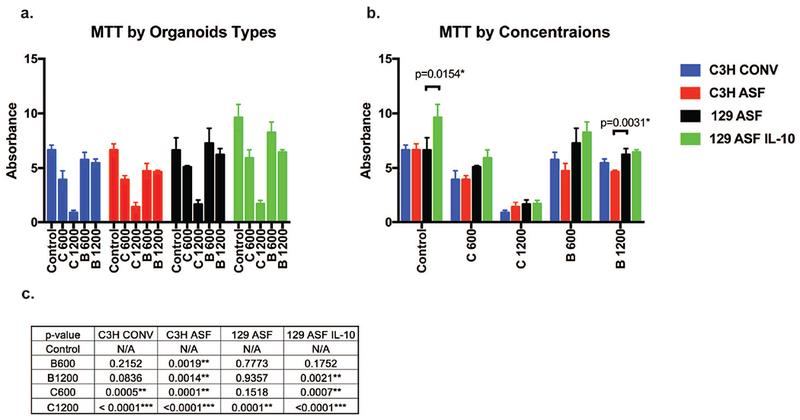
MTT assay was performed at day 7 of organoid growth. The same data was plotted differently for figure 5a and 5b in order to compare between the different groups. For 5a, organoids were compared under the same organoid type. For 5b, organoids were compared under the same concentration. For 5c, the p values for figure 5a are shown.