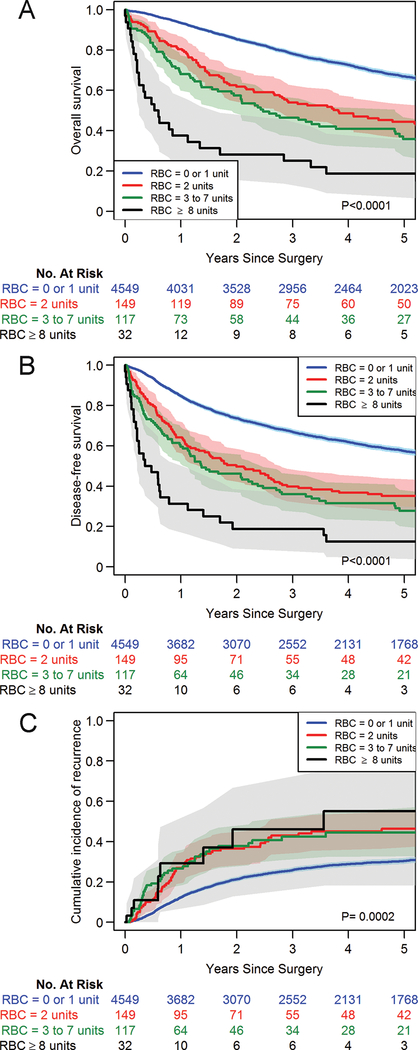
Figure 3.
Kaplan-Meier curves depicting a dose-response relationship for overall survival (A), disease-free survival (B), and cumulative incidence of recurrence (C) between patients receiving no or single-unit red blood cell (RBC) transfusion and those receiving transfusion with increasing units of blood. No matching weights were applied in this set of analyses.

