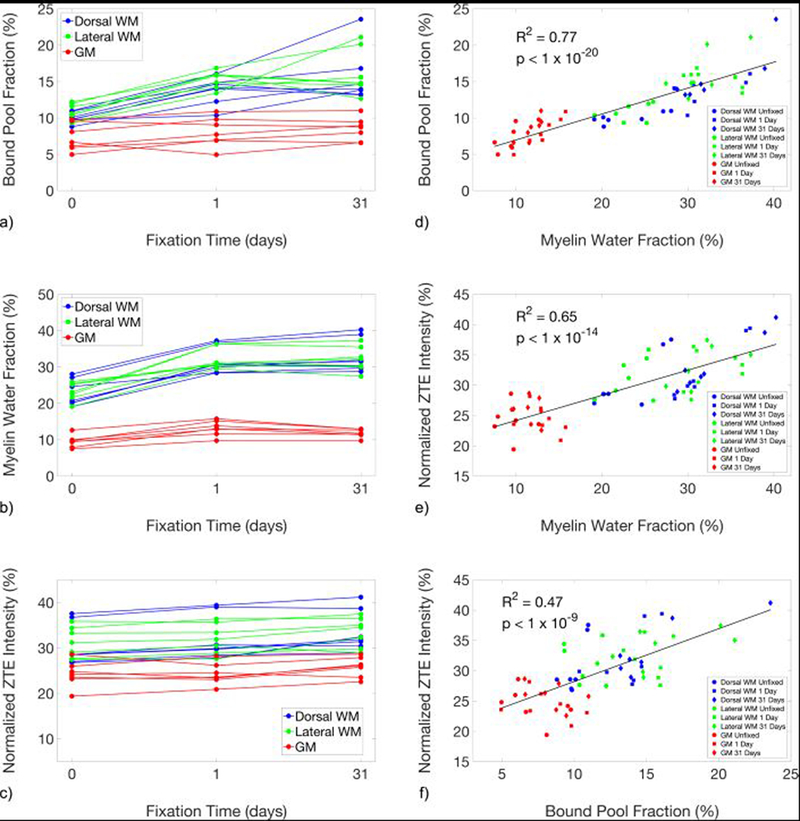
Figure 4.

Line plots showing the changes in the quantitative magnetization transfer bound pool fraction (a), myelin water fraction (b), and reference-normalized D2O-exchanged ZTE signal intensity (c), of unfixed specimens and after 1 day and 31 days of fixation. Measurements produced by the three methods (d-f) were correlated. F and MWF were particularly strongly correlated (d), which suggests a common source of bias due to fixation between these two indirect measures that is not shared with D2O-exchanged ZTE.
