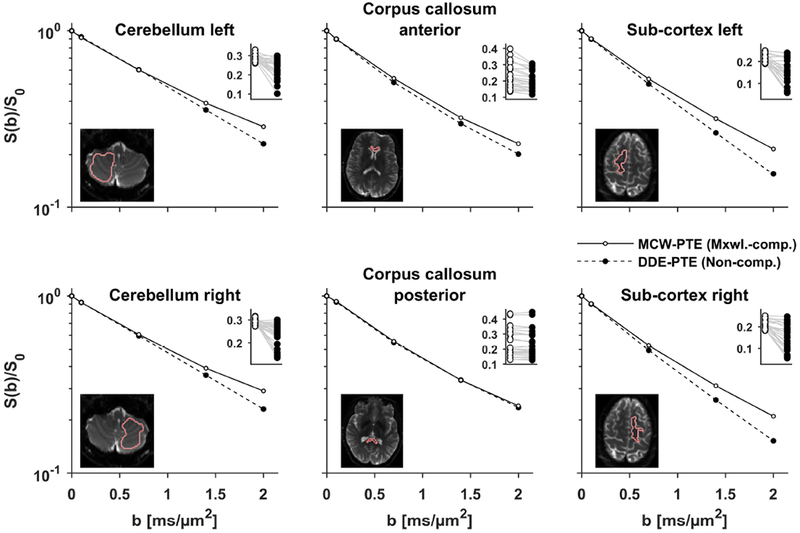
Figure 4 –

Plots show the signal vs b-value for planar tensor encoding produced by non-compensated (DDE-PTE, black markers) and Maxwell-compensated waveforms (MCW-PTE, white markers). In the main plots, the signal is averaged over directions, whereas the inset plots show individual directions at b = 2 ms/μm2 where gray lines link signal pairs encoded with identical b-tensors (Eq. 11). At low b-values the two waveforms are similar, however at larger b-values, DDE-PTE suffers gross signal attenuation due to concomitant gradients. The effect is largest in the inferior and superior parts of the brain, i.e. the bias is largest along the z-axis. As expected from theory, the effect is negligible in the posterior corpus callosum because of its proximity to the isocenter.
