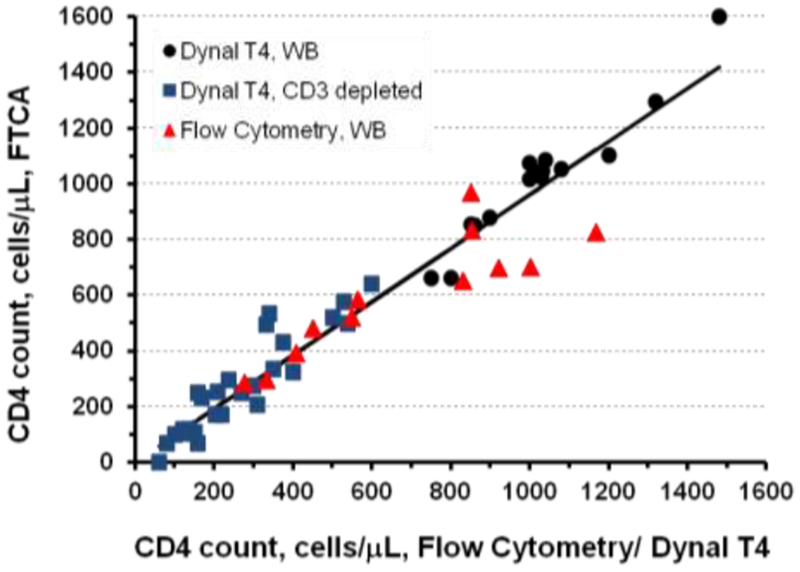
Figure 5. Correlation analysis of CD4 cell counts measured by FTCA vs reference methods.

CD4 cell counts of all samples (all data points, n = 54) were determined by FTCA calibration curve. HIV negative whole blood (WB) samples (black circles, n = 15) and CD3 depleted blood samples (blue squares, n = 27) were analyzed by Dynal® T4 Quant Kit. Flow cytometry (red triangles) was used to analyze HIV positive samples (n = 10) and HIV negative samples (n = 2, CD4 ≥ 1000 cells/μL). Statistical parameters of the correlation analyses are listed in Table 2.
