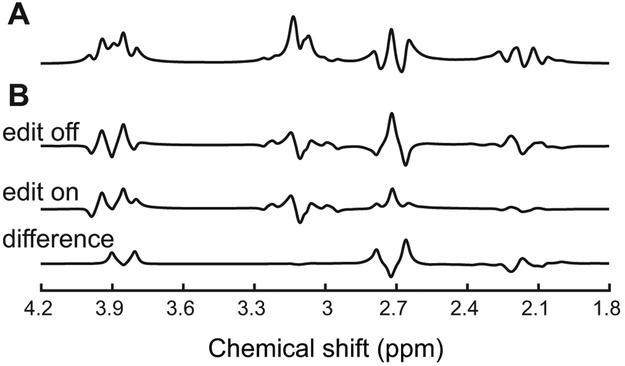
Figure 2. Appearance of cystathionine at 3 T.
Simulated (A) PRESS spectrum with TE = 30 ms, and (B) MEGA-PRESS edit-off, edit-on and difference spectra with TE = 68 ms and editing pulse placed at 1.9 ppm using chemical shifts and J-coupling constants reported in Table 1. Simulated spectra are shown with 2 Hz line-broadening.

