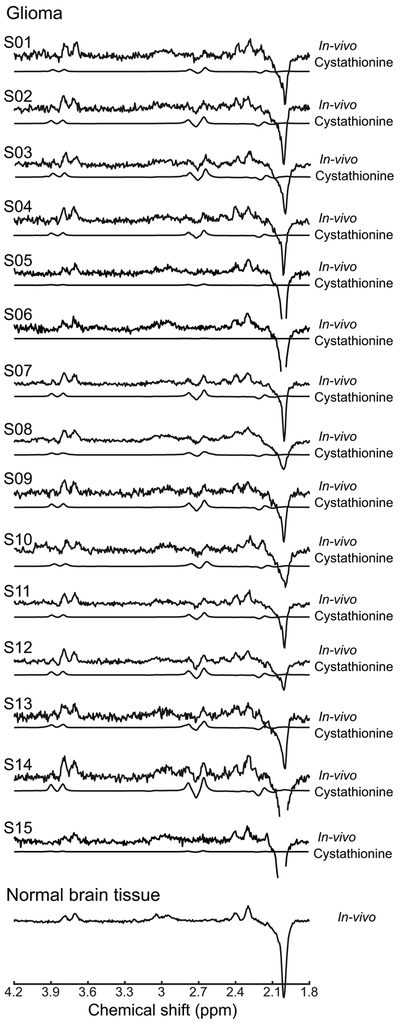
Figure 3. In vivo detection of cystathionine.

In vivo spectra from each of the 15 patients with glioma and one in vivo spectrum from normal brain tissue are shown with the cystathionine contribution fitted by LCModel. The cystathionine pattern is visible in 12 patients at 2.72 ppm in glioma, while it is not detectable in 3 patients nor in the normal tissue. Spectra are scaled with respect to the water signal. No line-broadening was applied. TR = 2 s, TE = 68 ms, 128 pairs of averages.
