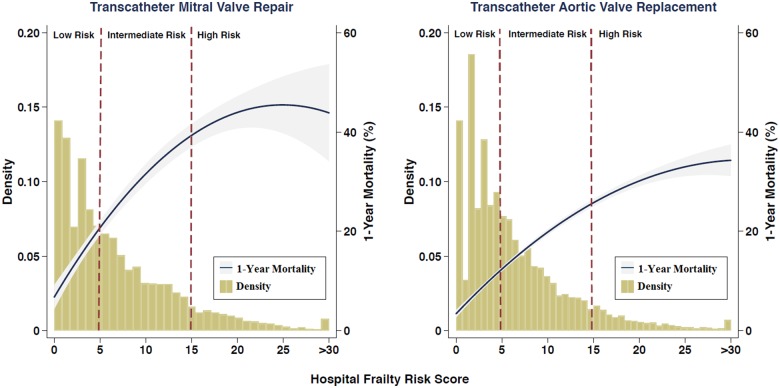
Take home figure.
The distribution of the Hospital Frailty Risk Score and its association with 1-year mortality in the transcatheter mitral valve repair and transcatheter aortic valve replacement populations using restricted cubic spline plots. The vertical red dashed lines show thresholds for categorizing patients as low frailty risk (score <5), intermediate frailty risk (score 5–15), or high frailty risk (score >15). Since there were very few patients with a Hospital Frailty Risk Score of >30, those patients are classified into a single group.

