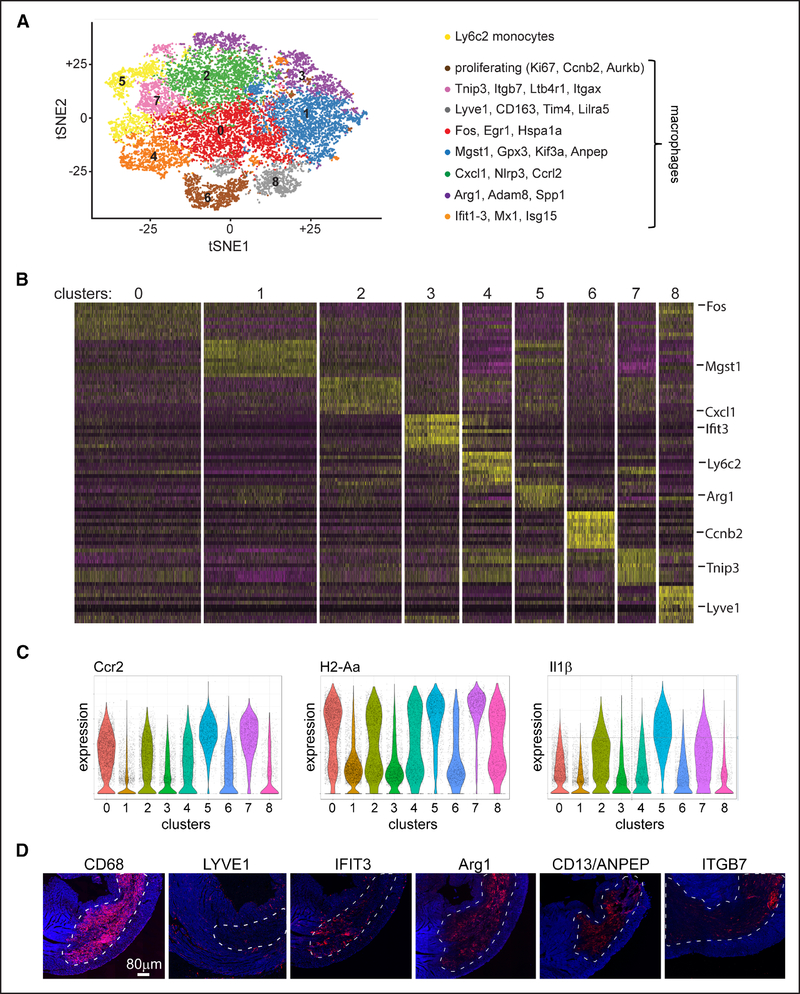
Figure 6. Single-cell RNA sequencing of monocytes and macrophages after myocardial infarction.
A, Unsupervised clustering of CD (cluster of differentiation) 45+Ly6G-CD11b+CD64+ cells isolated by flow cytometry from control, CCR2 (C-C chemokine receptor 2)-DTR (diphtheria toxin receptor), and CD169-DTR hearts 4 d after ischemia-reperfusion injury. Diphtheria toxin (DT) was administered before ischemia-reperfusion injury. Each experimental group consists of a pool of 4 biologically independent samples. Data are displayed as a tSNE (t-distributed stochastic neighbor embedding) plot. B, Seurat-generated heat map showing the top 10 genes by P expressed in each cluster. Selected genes are noted in the right column. C, Violin plots demonstrating that CCR2 and H2-Aa (MHC-II [major histocompatibility complex II]) expression does not resolve clusters identified by unsupervised clustering. Il1β expression is also displayed. D, Immunostaining of myocardial tissue 4 d after ischemia-reperfusion injury. 100× tile scans showing the relationship of macrophage subsets to the infarct area (dashed white line). Blue: DAPI (4’,6-diamidino-2-phenylindole).

